The difficulties and procedures adopted in regular Visual observation of the Lake are described below. While visual, it is important that we apply consistent standards, as pollution of Lough Allen is a very personal issue. One person may say it is fine, when another may say it is a mess! Most of our records come from boat trips. Apart from the weather, it is far easier to survey remote rocky shores and inlets by boat. We would very much welcome help with this work from people living on the shore of the lake, especially during the Winter period. We are dependent on visual observations as the dilution of the lake, and the general economic situation, means that technical analyses on a frequent basis will not be possible.
SCROLLPOINT Page Scrolls from here. Newest record below with older records further down... WL27: Bringing the Mussels back home!
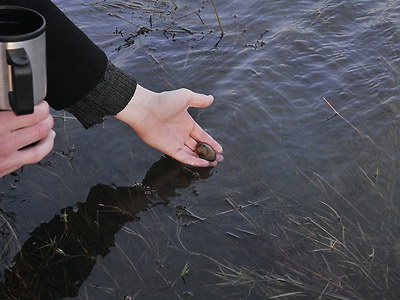
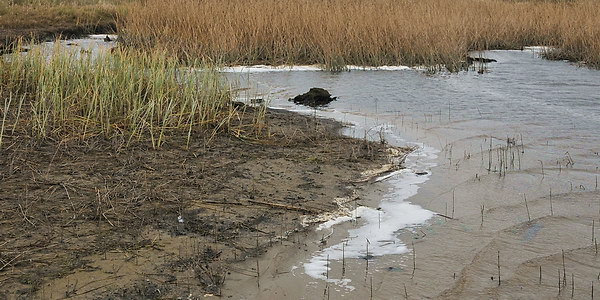
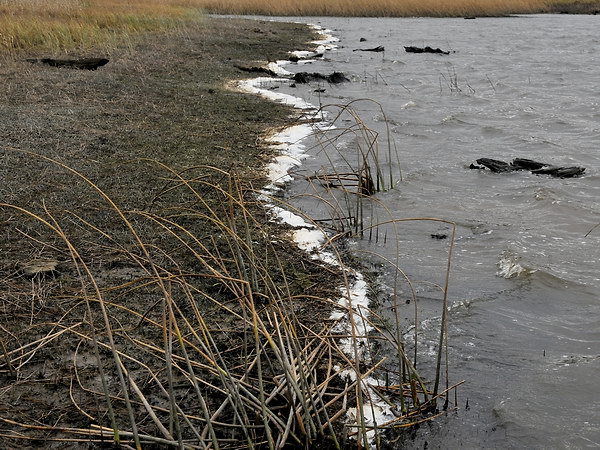
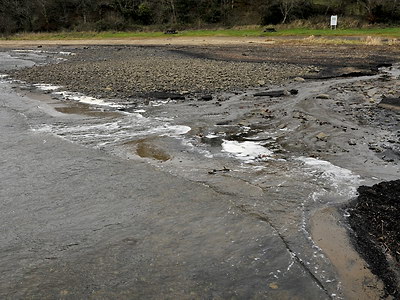
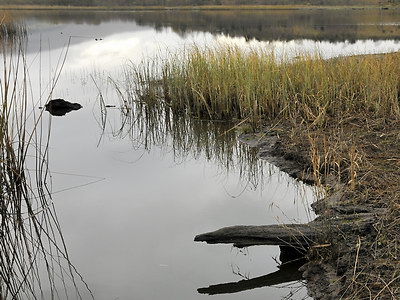
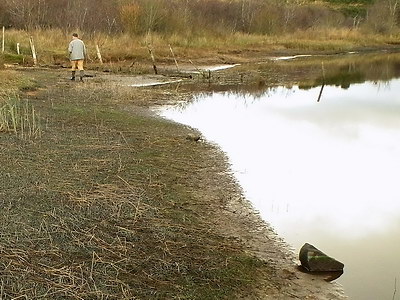
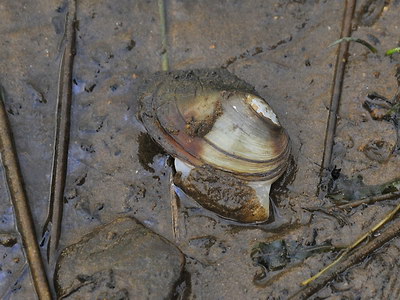
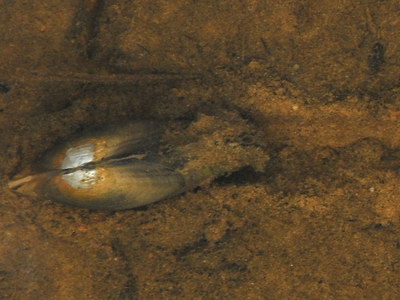
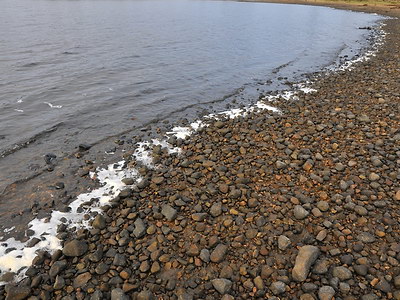
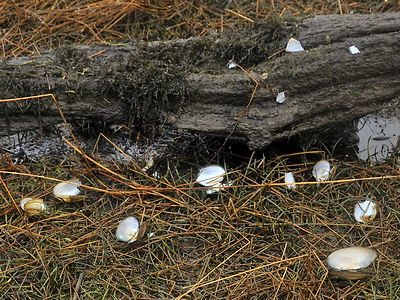
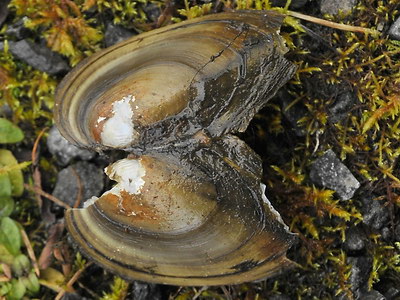
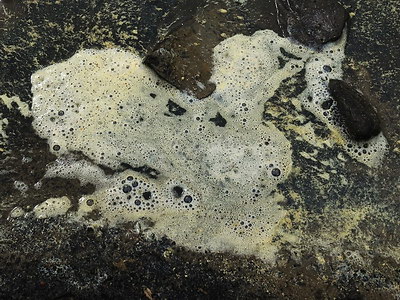
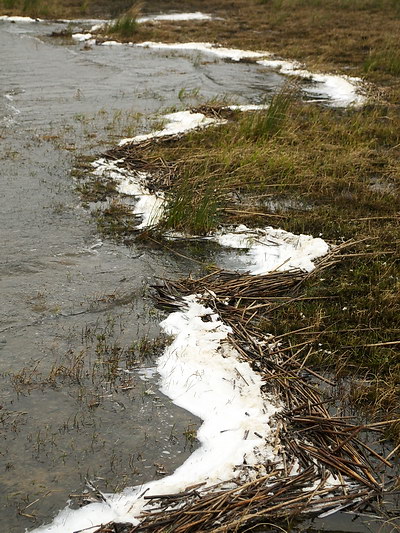
Happy Christmas everyone! Intro: Just a quick trip today to return Mussels to their home at Druminalass before Christmas! A cold afternoon trip with a dedicated helper to have one last check on the shore. As you can see the shoreline is totally different from previous occasions studied in December and November and all the area affected by the Blue-green algal bloom is now inundated along with the Mussel shells, bog-oak and remnants of that bloom. There was no sign of any Cyanobloom now remaining either here or at Annagh Lake or at the inlet from Lough Allen. This, of course is both a good thing, and a silly thing, to have to report on Christmas Eve! Much recent rainfall had caused a substantial rise in water level and this had obliterated and possibly killed the Blue-green algae but we will check again at low water conditions in the New Year! Returning Swan Mussels: As reported in previous logs we had found many intact Mussels lying stranded on the shoreline affected by Cyanobloom. These were closed and probably alive and we were concerned that they had been sickened by ingesting toxins from the bloom.
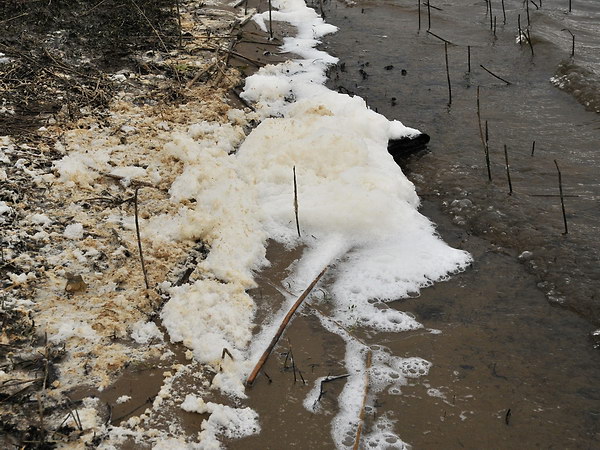
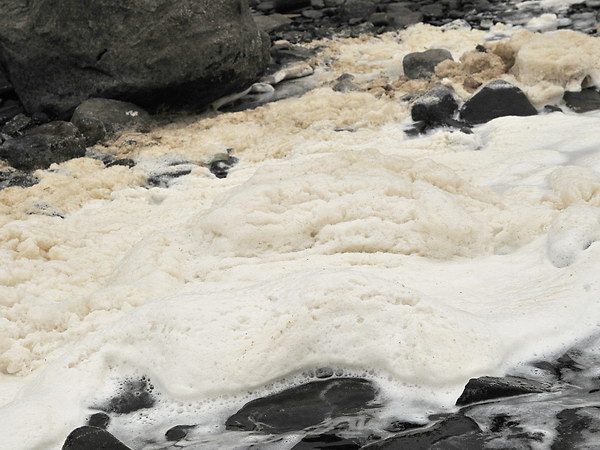
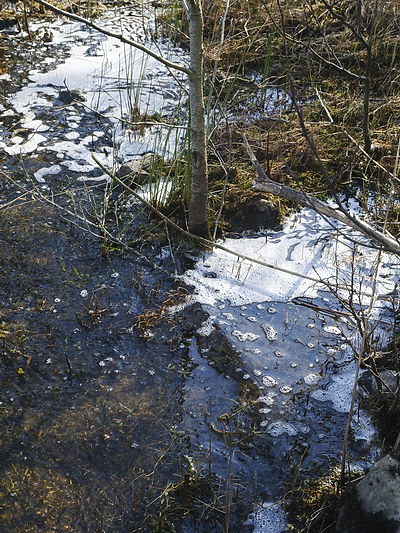
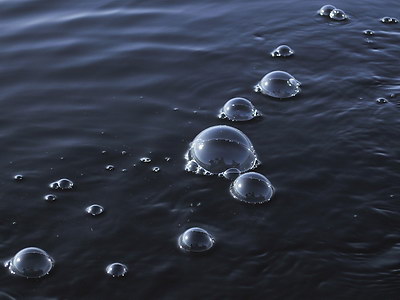
WL26: Severe contamination of north shore of Lough Allen Intro: Another very disappointing day with widespread contamination on south facing shores and large piles of surf building up in places. But, the good news is that the virulent bloom we have been watching over the past fortnight is not now visible in Druminalass in its active green form. This is not to say it is gone. Unfortunately the trigger which led to so many mussels dying is very evident in the form of much foam lying on that shore and the incoming stream from Annagh Lake. We expect a Cyanobloom to recur at some date where this foam has landed! The Images: We are, with regret, presenting images of the situation on the shores today. This is very unfortunate at a time when we are engaged in planning a worthwhile conservation project for Spiranthes romanzoffiana, Lough Allens valuable orchid. Like many people we felt that the large amount of surfactant material in Lough Allen was being washed through and the input of contamination had declined. Perhaps the good Summer weather in some way reduced the appearance of these problems? Now we are seeing foam everywhere and as soon as you walk in clear water, bubbles appear and stay. We believe it is contamination, i.e. some unnatural product emanating from human activity that produces many persistent bubbles and also probably provides the phosphate for the Cyanoblooms. So depressing!
Other Areas: Initially, this survey was planned to confirm that the Cyanobloom present in Druminalass had subsided. Finding so much foam there, the rest of the morning involved checking other likely or vulnerable areas. Likely areas in todays weather conditions meant any south facing shore; vulnerable areas refers to areas where health worries or loss of pets indicated that a serious Cyanobloom had occurred in the past. Of course the north east corner of Druminalass is protected from a southerly wind and the build up of foam here may have been a local phenomenon with a local source of contamination. It is hard to envisage large amounts of foam coming through the narrow cut into that inlet. As it happened the Lough Allen side of that cut had only slight amounts of foam and no pictures are presented. Similarly, Kilgarriff where foam was present but in no great quantities either.
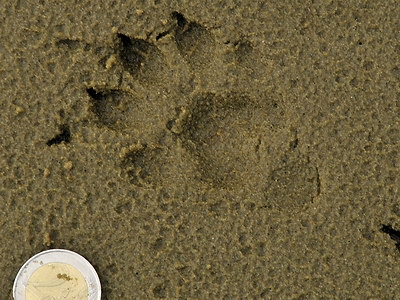
WL25C: Update: Little fresh Bloom remaining Intro: The unexpected Cyanobloom at Druminalass has been very worrying and the damage to biodiversity significant. The Otters have had a great meal, hopefully at no cost to their health. On a visit to the site today (one of many in the last 10 days) the situation seemed to be stabilising with only a small quantity of active green bloom. We would be hopeful that it might further decline but there is evidence of potential bloom causing contamination all along the shore. This, and remaining warm weather pose a threat to wildlife and environment.
Comment: Possibly this Bloom may now end. Cold weather will help that. However, continuing dumping of detergents or artificial surfactants seems to be ongoing and a respite seen during the Summer may have only been a response to warm weather. The visibility of foam seems highest in cooler weather with calm or gently agitated water. Testing for foam is difficult. Phosphate levels can be measured on the assumption that the foam is an indicator of detergent or water treatment type products (containing phosphate) in water entering the lake. But the link between phosphate levels and foam levels has not been proven though strongly indicated. We will continue to monitor the area... WL25B: Update: Mussels dying because of Pollution!
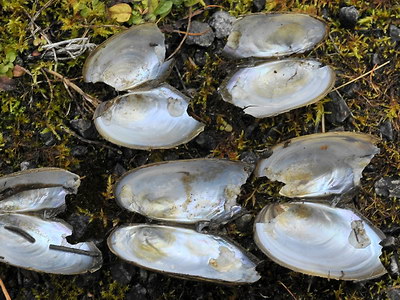
Part I: Of Mussels and Pollution. Intro: Swan Mussels are indicators of pollution. They are now dying in excessive numbers in Druminalass. Another good weather day prompted a further research trip to Druminalass, Annagh Lake, and the Yellow River mainly investigating Jack Snipe, Goldeneye and Mussels but keeping an eye on the rapidly changing water situation. Firstly, it is dropping more now extremely low for end of November. Secondly, whilst in many areas Lough Allen looks clean there is a return to the worrying pattern of persistent foam lining certain shores, scum on the open water, and Cyanoblooms (= blooms caused by toxic bacteria-like micro-organisms). What is causing Blooms in November/December? These are not meant to occur in Winter as the prerequisites for Cyanophyceae to bloom are calm water, sunshine and warmth. What we have had is a bit of warmth, low rain recently and a dropping lake level exposing mudflats. In the absence of a clear theory we present much data and observations here. Already some patterns are starting to appear. With a bit more evidence it may be possible to determine a cause and work out preventive measures. Of course, we tend to attribute these problems to an upsurge in visible contamination in the Lake over the past 5 years? We summarise knowledge to date in the Table below. This is intended to sharpen our focus and to share ideas and observations to date. But, it clarifies issues if we can outline some specific information and then supplement that with images at the bottom of this Log.
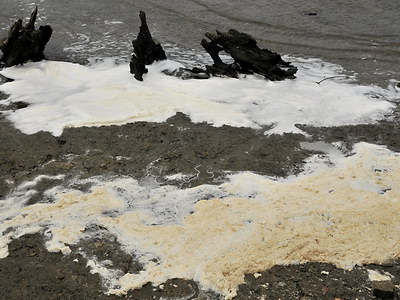
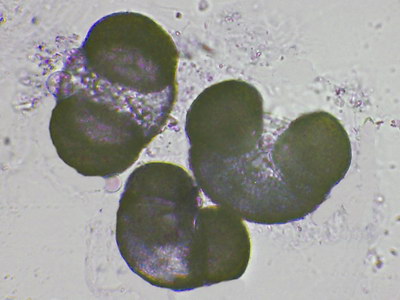
Conclusion: This is one time we cannot give any rational opinion. Presence of a Cyanophyceae Bloom in Lough Allen at this time of year is very disturbing. It generates large numbers of new cells which have the ability to sink to the bottom of a water body and re-surface next Spring or Summer. However, cold weather is promised and the area in question is shallow a prolonged spell of cold weather might well bring this present outbreak to an end. Lets hope so? Images and Analysis: We present more images than usual below in the hope that some evidence there may trigger a response from people expert in this area. We would hope that some steps can be taken to reduce any pollution attributable to artificial contamination and that the, largely bloom free, Summer of 2013 can be repeated again next year. If anyone reviewing the report below has any insights into what is going on... we would very much like to know! For the record, both the blooms seen at Druminalass and at Annagh today (see Part II) were again mainly composed of Microcystis (as described in a previous Water Log.)
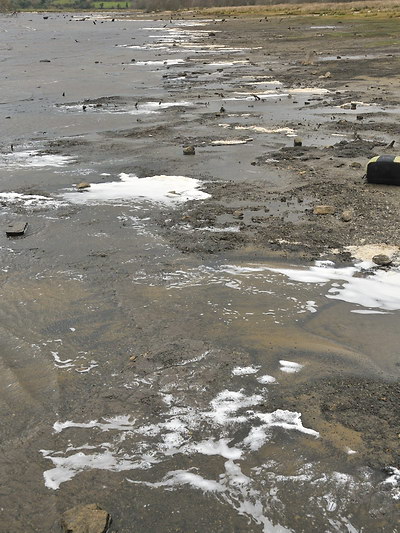
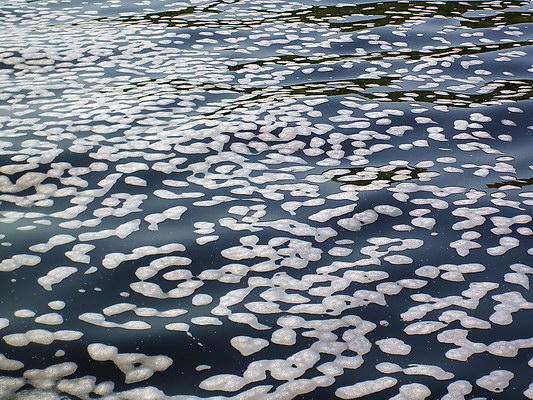
PART II: Visible Contamination elsewhere. In researching the problems described above it was apparent that there were some increasing contamination issues in Lough Allen. This comes after a long hot Summer when water temperatures reached 24°C. and there was no Cyanobloom worth noting on the Lake, just fairly routine levels of harmless green algae ( the stringy stuff) in late Summer. Also, visible contamination was markedly less during the summer. Persistent foam such as this requires a gas (air) and a surfactant to persist. It is possible that the warm Summer weather caused the gas to expand and burst the bubbles almost instantly! It is sad that this problem is back and obviously so; we had hoped it was a diminishing problem but it seems simply to be a problem of cooler weather. These shiny white fringes have been a feature of Lough Allen shores since 2008 when we first noticed them They have been matched by large persistent bubbles being left by boating or other activity in the lake again indicating an overdose of surfactants! We reproduce 3 images to briefly represent the problem, but wed really much prefer if it would just go away and leave us in peace!
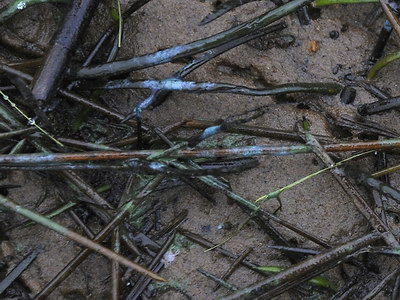
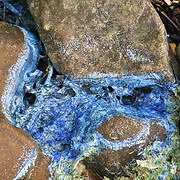
WL25A: Update: Bloom has cleared? Intro: A return trip was made by foot this afternoon with the intention of collecting more specimens especially where the foam occurred in the second photograph on the left (below). Lo and behold, the bloom haws completely vanished, at least in the form of a green soup. Initially the shore today looked clean, but littered with Mussel shells. On closer examination it could be discerned that this bloom had covered an area of 100m along the shore and 5m from the top of the shore to the edge of the band of Horsetails and in the water. Water level has again dropped sharply since the previous report and most of the shore occupied by the bloom then is now dry as if the bloom has been absorbed into the ground? On that dry shore and on the stems of vegetation in the water, traces of the Cyanobloom can be discerned now starting to go that dreaded cyan colour typical of a Cyanophyceae bloom. Small traces of green cells can be seen on the shore but, by and large, the remnants are now turning blue! What on earth caused this bloom to come and go so quick and why have we not seen it anywhere else in Lough Allen. It still seems that caution needs to be taken when entering the water of Lough Allen. Examination of Cyanophyceae Bloom at Druminalass Lake, Fahy, Lough Allen. November 25th - 28th, 2013 (Lat/Long: 54.160520, -8.026037)
Doubtlessly, this report will bring up more questions to be answered. But dont eat Mussels or enter the water if it is pea soup green. County Council have been informed.
WL25: A SETBACK: Late November Cyanophyceae Bloom!
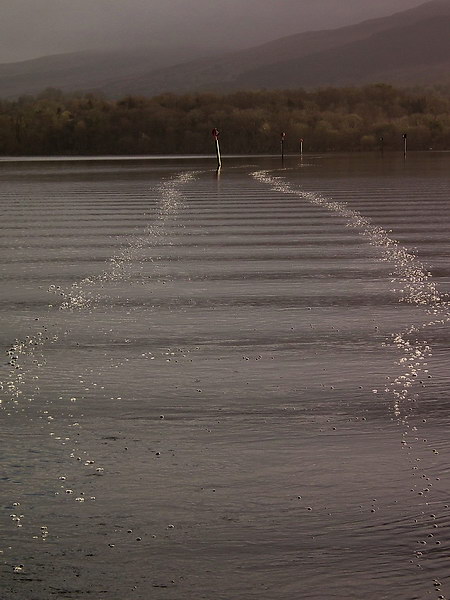
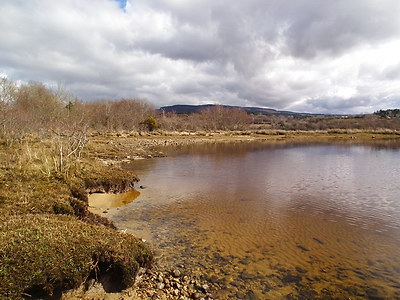
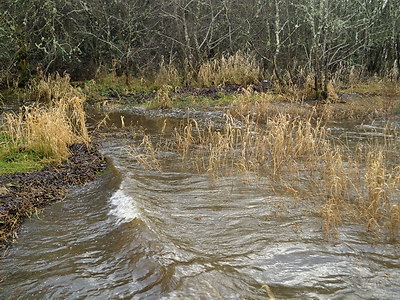
(Rather a beautiful picture but whats it doing here?) Intro: An opportunity was taken to survey the northern end of the lake today, mainly for Waterfowl. Unfortunately, following a period of growing optimism that Lough Allens water was getting clearer todays trip, from a water quality point of view, proved disappointing. Initially at launch at Corry Strand the local stream and shore appeared clear. Unfortunately the business of launching our boat generated some long-stay bubbles in the otherwise clear water and these were further apparent as we started moving. Persistent bubbles were produced indicating some heightened surfactant level in the water, some foam was visible on a south facing shore near Drummans Island. Finally, unexpectedly a significant area of very virulent Blue-green Algal pollution was encountered on the north shore of Druminalass lake. As indicated above it seemed safe to assume these would have been gone for the Summer? This disappointing discovery (unprecedented in November) has been a bit of a set back and is the subject of this report.
2013 was a year in which we feared pollution but suffered little. It was hot, calm and sunny at a time when a Cyanobloom could be expected but the water though warm showed no serious bloom with only Green Algae (which we regard as benign) becoming evident in the Autumn where it was to be expected. It is very sad to now be getting a fairly robust colony of the potentially toxic Cyanobloom towards the end of November when this should normally be over! REDUCING THE INFLOW OF ALL POLLUTANTS AND CONTAMINANTS INTO LOUGH ALLEN WOULD GREATLY HELP THESE RECURRING PROBLEMS!
WL24: Hunting the Phosphate. INTRO: Todays work was office based bringing together a couple of strands we have been investigating regarding Phosphate and Foam in Lough Allen. These two products are not intrinsically linked. The foam is the result of surfactants and gas (or air) mixing. Phosphate, in this context, is a possible nutrient enriching Lough Allen and possibly making it easier for lethal blooms to develop. If you read the preceding several WLs you will see that this is a receding problem, foam is less, phosphate is at low levels in streams, and there has been no serious Cyanophyceae Bloom in the Lake this year. However, this was a phenomenon that seemed to develop suddenly from about 2008 and whose cause remains uncertain. (Today we are investigating increased levels of phosphates in rainwater, but an increase in such nutrients followed by a decline can also occur after clear felling of Forestry such as occurred near Dowra and Arigna during this period.) ANALYSIS: Foam can come from natural sources but most of this has different characteristics to the sort of white fine foam that has been appearing around Lough Allen in the past several years. Synthetic based foam typically has this appearance. In the absence of any other clear cause we have postulated that the widespread dispersed source could be Treatment Plants or the installation of newly specified Septic Tanks in one-off dwellings around the Lake! The reasons for this hypothesis are... the persistent nature of the foam, very fine texture and ability to re-appear time and time again, the similarity to foam coming from known Septic Tank sources, and the history of the two events. However, in more recent years, we have seen such foam in surprising areas like upland forests, blanket bogs, and fresh rain water sources. A very good example was along the road from Ballinaglera to Ballinamore over Bencroy. In a drain beside the road we spotted a lot of foam of this nature too high up to be of normal domestic origin. We followed the drain for about a mile wondering could Sphagnum or Sheep urine be providing the surfactants and believing that it could not be a synthetic source that high up? Eventually, we came to a small dump beside the road almost entirely made up of Fabric Conditioner bottles! Obviously this fed our prejudice is it still possible that all this new foam is coming from altered natural sources? OBSERVATIONS: In the drain (shown below) at the back of our house we have often observed foam after heavy rain in recent years. There is no higher ground adjoining this drain and there is no obvious other source of detergent, phosphate, or surfactants. Normally the foam is bright white. Today (12th Sept. 2013) it was pink!
Analysis were done of the phosphate levels in the drain (shown), from the downpipe before it entered the drain, tap water, and clean rain water directly from a sterilised stainless steel container in an open site during heavy rain. LEFT: RIGHT:
CONCLUSION: The presence of foam in this location in recent years parallels what we have observed around Lough Allen. The source of the foam in this instance can be the rain, the roof, or splashing off the wall though this seems unlikely. The colour of the foam, a new phenomenon, is also very interesting. This mirrors the colour of stains on our house in the past, often attributed by builders to fungus or iron. However, it looks to us very like that widespread bacterial slime that one can get on walls, or draining boards, or basins where these have not been used for days. This is caused by Serratia marcescens (sometimes called the Miracle Bacillus), an airborne bacteria that thrives in wet places with phosphorus containing materials (e.g. soap) To fine tune this study we then collected water in sterile containers away from any overhanging objects, i.e directly from the sky! This and the above drain sample were all tested for Phosphates and the results are shown in the Table above. Because of the need to maintain cleanliness no collection sytem was used for the rain sample, just relying on a large stainless steel saucepan and heavy rain. Samples were small, enough for phosphate analysis but not enough to try and generate foam. However, no foam was visible in the direct rainfall samples. The implication is that the foaming agents originated from our roof or its biological colonies bacterial, mosses or fungal? The important question remains could there be phosphate in rain? Phosphate in Rain? It seems that there is! In very small quantities? An interesting study in New Zealand (1976) found that... Nutrients in the rain falling on the surface of lake Rotorua provided approximately 5% of the reactive Phosporus In G.R.Fishs article in the New Zealand Journal of Hydrology he states that in tests run between 1972 and 1974, sampling 341mm of rainfall, there was on average 0.057gm Phosphate/ha.mm (per Hectare per millimetre). This equates to (0.057gm /m3 X 10) or 0.057 ppm Phosphate which is similar to the results we have got. High rainfall areas received higher levels of nutrients. One thing we have noticed during this time is the onset of heavy rains in the late Summer/early Autumn period in Lough Allen. In most years since 2008 the rare orchid, Spiranthes romanzoffiana, has been drowned while still flowering or shortly afterwards. 2013 has been an exception in this regard. Maybe the lower Summer rainfall this year has been a factor in reducing nutrients (phosphates and nitrates), preventing a bloom, and reducing the presence of foam in streams and on the lake shore? WL23: Another clear day! In between the Reports from WL18 - WL22, below, there have been many days when observations have been made of, or on, the Lake showing the water to be very clean. For the purpose of the WaterLog it is not possible to record every good day. After all, these should be the norm rather than the exception! But it can be seen from the pattern of these Logs that there is a steady and sustained improvement in the water of Lough Allen, particularly as compared to last year. This is a great relief, the cause is not clear, but hopefully the foam will continue to reduce and a blue-green algal bloom may never recur. Certainly, for this year we are confident of that! But it is important that we all seek to reduce any levels of contaminants that may be entering the lake as weather conditions in future years could use this pollution to trigger another disastrous algal bloom. Today, was a good example, overtly a perfect day but with some shadows lurking in the bushes!
WL22: Small amounts of Foam back! This was a shore based trip aimed at checking out another area for Spiranthes. The environment is suitable for the orchid but none have ever been found here. Unfortunately some noticeable examples of that bright, white foam, that has been largely absent from the lake during the hot Summer, was present again. Green algae were present but there was no sign of blue-green algae which is good news.
WL21: Largely clear again!
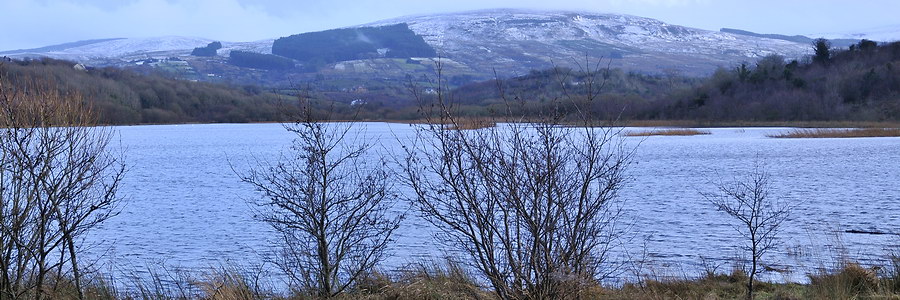
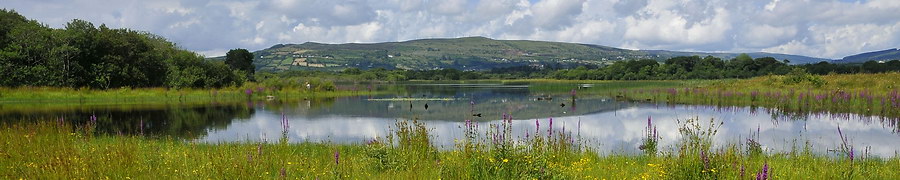
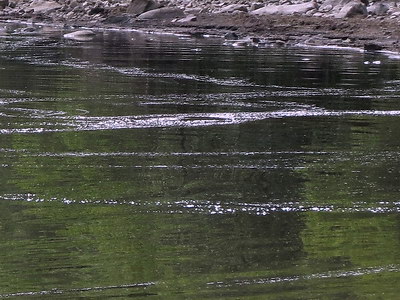
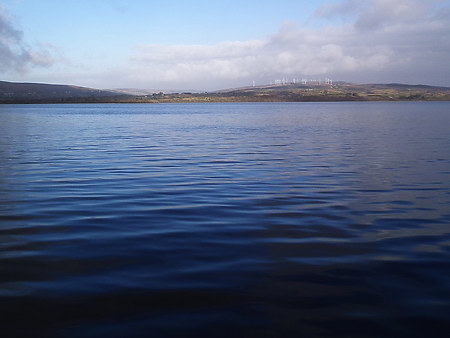
WL20: Some signs of water contamination. Intro: Two small concerns regarding the water quality arose today in parts of the southern end of Lough Allen, around Long Island (off Cormongan) and Spiranthes Islands in the Drumshanbo basin. One related to foam and bubbles and the other was a small Cyanophyceae bloom. But it must be said these are small niggles, may not develop into anything, may be temporary and may not reverse the generally improving conditions we are seeing. The banner picture below does fairly represent the overall good condition of L. Allen at the moment...
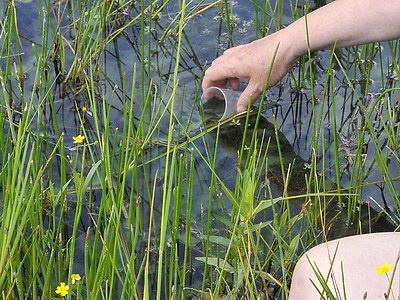
This is Spiranthes country with Spiranthes orchids occurring both on the shore (Right) and the islands on the Left (in former years). Observations: I Presence of Bloom.
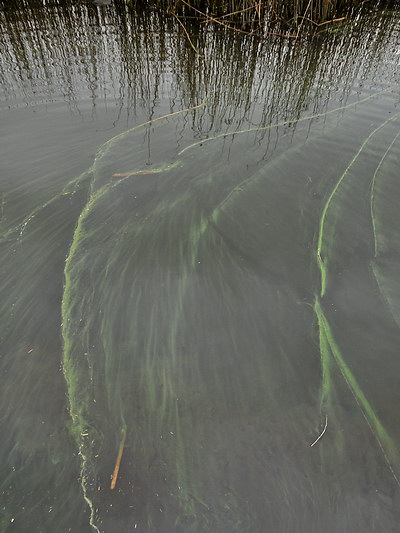
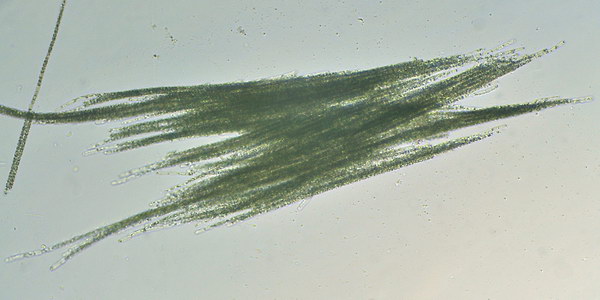
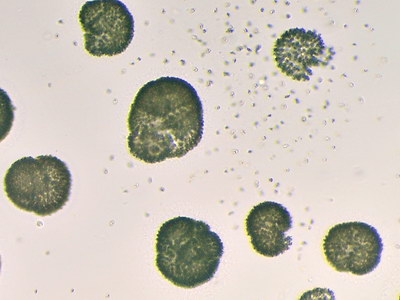
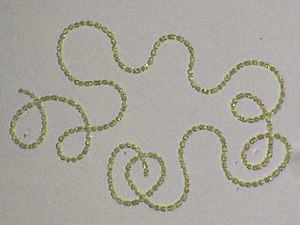
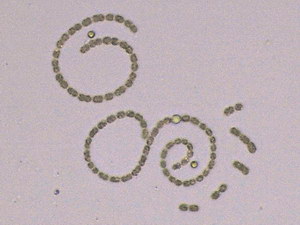
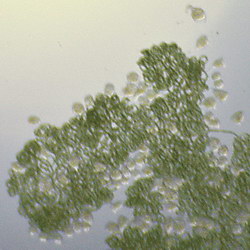
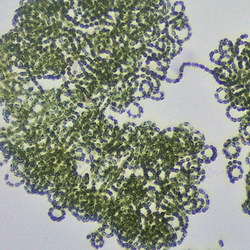
Both the fine specks and the congregating colonies of blue-green algae can be seen in this image. They are starting to form linear streaks and larger rounded colonies. This is the intermediate stage between cells being present in isolated or small clusters and all the small colonies merging together as a major bloom over a lake or part of a lake. Thankfully, the area involved was quite small, c. 20 sq. metres at the concentration shown in the photograph, but present in most of the channel at a lower concentration. Specking was readily visible in the open water to the south of the islands for about 70 m. off shore, but this was too dispersed to sample. Samples were, however, taken in the area shown. and have been examined. Sample Assessment: In the Table below we present some images and observations of this occurrence. Overall, we do not see this as a significant concern at present. Two quesions spring to mind. Why did this occurrence of Blue-green algal bloom occur at a time when our heatwave was cooling down? (Possibly lack of observation / possibly calm conditions and concentration of heat and nutrients in shallow water / possibly ever present seeds near human activity (such as the Locks at Drumshanbo) spreading further into the Lake?) Is there a likelihood of this developing into a large scale toxic bloom? (With present cooling and breezy weather, we dont think so!)
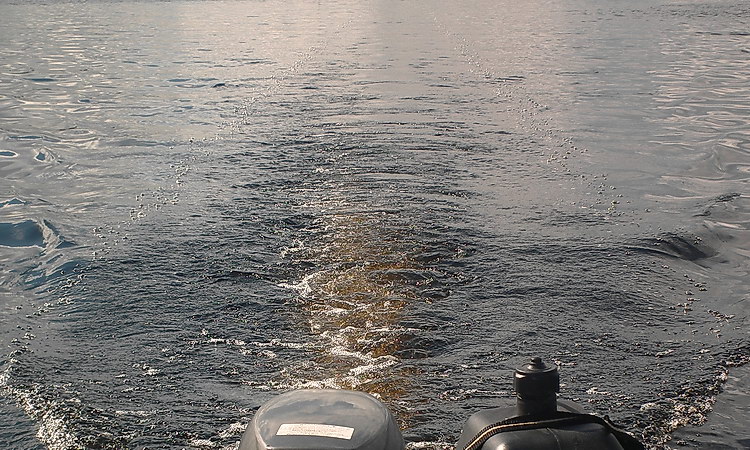
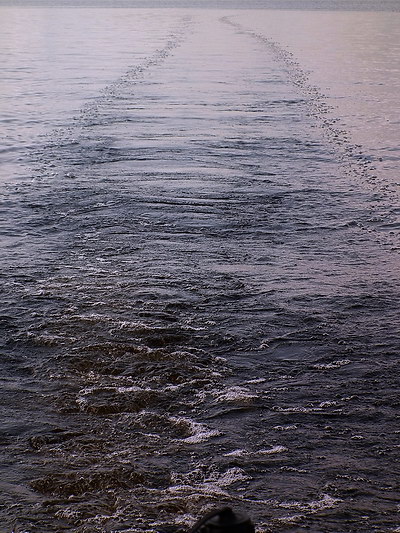
A small amount of foam is appearing in patches around the lake (Corry and Cormongan). It is very slight and does seem to burn off during the day. Present warm and breezy conditions do not seem to sustain foam for long and it has to be said that areas of foam and streaks of scum that have concerned us particularly in mid lake off the 3 Cormongan islands are largely a thing of the past. However in this general area water surface tension (an indicator of surfactant presence) is lower than it has been in recent weeks leading to more noticeable sustained bubbles in the wake of the boat. Admittedly we have reproduced this photograph at rather a large size. Five Bubble Tests were conducted in in all areas of the lake from Drumshanbo up to Cormongan. Test sites were chosen when persistent bubbles were detected in the boats wake. Under parameters defined for quantifying these observations, the record described below was the most significant. DATA: Mid lake southwest of Round Island, 1040, 26/7/2013 This yields a Score of 3 which we have defined as Serious! The image on Right attempts to show these criteria with golfball size bubbles behind the boat and those bubbles remaining visible back up to the top of the photograph which approximates to the start of the run. We do appreciate that this image is not as clear as others we have shown taken in calm water. But the trail was evident enough at the time. CONCLUSION: We have seen much worse results earlier in the year, and last year, but this one is recorded as it does fit all the parameters laid down to help standardise this class of visual sign for water quality change. The presence of large persitent trails behind a boat is not a good sign, does suggest the addition of artiificial surfactants and these, if they come from detergents also containing phosphates, may provide the food needed by the Blue-green algae!
WL19: Hot Weather monitoring, Day5 Intro: Hopefully this may be our last WaterLog for a while. We are confident that the lake is over its risk of a major bloom as it is presently clean and water temperatures are abating somewhat. We chose the areas visited to check for the emergence of any Spiranthes orchids and to look for shore line pockets of Cyano-bloom. Neither were found! Observations: Rossmore is a prime site for L. Allens rare orchid. This is the perfect time for them to start emerging, though it does vary a bit. Rossmore does not have a significant stream entering into it and is connected to Lough Allen by a wide channel, so there is a ready interchange of water with the main lake. A small bloom was reported here on the 7th July. It is now totally gone! Nor did we see any Blue-green algal bloom at the other two sites visited today or anywhere around the lake since the 7th. This is brilliant considering how warm it has been and, though rarely flat calm (which these organisms love), it has been very close to it for long periods in the past 10 days. We would now consider Lough Allen safe to swim in and safe for dogs. We have not heard any comments of people getting rashes from entering the lake this year? Detergent and bubbles remain a slight probem affecting the appearance and appeal of the lake. But, hopefully, they too can be eliminated. What we did see today was an increasing amount of Green Algae but in perfectly normal amounts and of no concern. The only significance of this material is that its name may easily be confused with the toxic and dangerous Cyanophyceae (Blue-green algae). They are very different and the images below are of Green algae which is harmless and natural in a lake like this.
Comment: This has been a hectic week, and a worrying one, but it turned out OK! Having weathered the heatwave we have a lot of confidence in Lough Allen for the rest of the Summer. This may be the last frequent WaterLog for a while, unless something unforeseen happens. There are still issues with Lough Allens water, and the way we treat it, but certainly the resilience the Lake showed this week to a major change in temperature and a complete reversal of weather patterns, was both reassuring and very puzzling!
WL18: Hot Weather monitoring, Day4 Intro: As described in previous Log, the main purpose of this trip was to complete a survey of water temperatures around this lake. Water temperature, calmness and sunshine are important factors in the development of any algal bloom. None was found! Some worrying scum was found in several places, particularly in a region that was badly polluted in 2011. This is a bit worrying and details are provided here. However, it must be emphasised that no sign of a Cyanophyceae bloom was detected and the water, though not as pristine as previous days, seemed fairly clean overall. Both these factors may be due to the choppy or rippled water during most of our trip. Observations: In recent Logs we have gone to some lengths to describe L. Allen in generous terms. Today, some of the old features came back unexpectedly. Foam was present on eastern shores and in a ribbon in mid lake. The nature and thickness of the foam accumulating in mid lake was surprising for such mild conditions. Two days ago in perfect conditions none of this was visible. Furthermore, in one area along this foam it seemed that there were some green spots present. This is an area of upwelling water and we are used to seeing small planktonic or dead organic material moving around. In most cases it is brown or grey and proves to be dead. Samples of the green flecks were collected and examined and the results are described below. But, first the big picture...
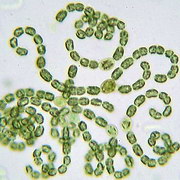
The two litre sample collected contained 5 colonies, about the size of the tip of a needle. This is as low as you can go and the water is pure at least in regard to blooms; the detergent problem still remains. One part of a colony is shown here. Interestingly, these colonies of Cyanophyceae were not strikingly green; maybe there is not enough nourishment in the lake to sustain a bloom anymore. Remember, Lough Allen used always be regarded as oligotrophic (with few nutrients) and it is only recent changes that may mean it is heading towards being mesotrophic with a fair amount of nutrients. If incoming phosphate bearing contaminants can be kept low the problem of blue-green algal blooms could be a thing of the past! LEFT: Overview of a small colony being actively grazed by rotifers (planktonic animals) RIGHT: Closer view of the cells, chains, and clusters, that go to form a colony. This is Anabaena sp., one of the toxic varieties but absolutely harmless in the numbers presently found in L. Allen. Comment: Fortunately, the problem may be restricted to foam and its unsightliness! The sample taken from line of Scum contained next to no Anabaena colonies. Blue-green algae are actually bacteria and like all bacteria they are widely present, only causing a problem when they go out of control. Unlike most bacteria, they photosynthesise in a manner similar to plants using chlorophyll. This gives then the green colour and makes even small numbers of colonies easily detectable in dark water.
WL17: Hot Weather monitoring, Day3 Intro: Even hotter today but the water at the north end of lake is clean and clear. A return vist was made to Rossmore the only area where we have found Cyanophyceae this week! Travelling by foot the east shore of Rossmore inlet was surveyed and then the east shore of Rossbeg bay was intensively searched for Blue-green algae.
It looks very much like Lough Allen is weathering its stress test with flying colours. Today and yesterday were two special days when it was a joy to be out on the lake. Blooms may still occur in shltered areas but we are amazed at how the lake is withstanding all this sunshine (vital for the blooms to photsynthesis) and calmness (crucial for colony formation) when two years ago in much colder weather (April 2011) a significant bloom developed right down the centre of the lake the area we covered yesterday.
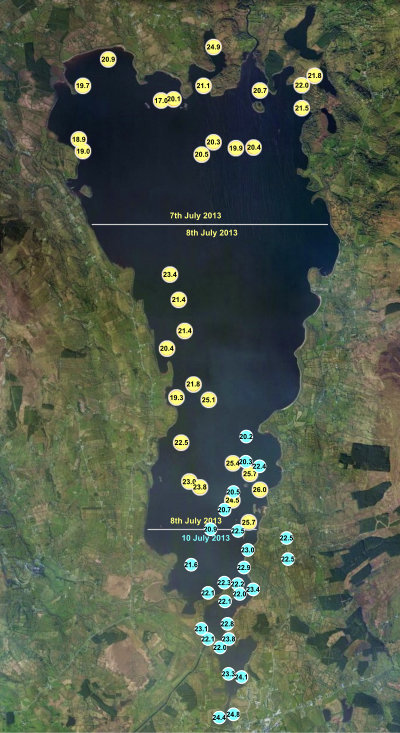
WL16: Hot Weather monitoring, Day2 Summary: A quick upadte for Monday, 8th. Survey areas was mid lake, south of a line from Cleighran More to Tarmon and north of a line from Arign to The Spit and Round Island. Both sides and central lake were checked for water quality. On this day the lake was perfectly clean with clear brown water, no harmful plankton, and no sign whatever of pollution. Water temperatures were incredibly high, mostly from c. 22 - 26°C with a few locations somewhat cooler. This is an amazing rise in temperature over a day or two. We are plotting our data and will update this page soon but we just wanted to say.... we may have got it wrong about the risk of a Blue-Green algal bloom! The conditons now are textbook. But the only small occurence we saw in Rossmore has been checked and is diminishing! Temperature Map 7th - 10th July, 2013 Mapping: We have mapped temperatures, and change of temperatures, during this recent very hot weather. From a low of barely 15°C on the 6th when Leitrim as exposed to cold breezy weather due to a west coast front keeping the Sun away from us, the air temperatures have risen to an unusually high 28.5°. Water has now shown an equally dramatic and sudden change. We had planned to be in a position to provide an early warning of an incipient bloom and not be caught out like last year with the sudden onset of cell multiplication and toxin release. There is now no need for this work, thankfully! What started out as a wise precaution against changing water conditions has now, happily, become a matter of curiosity about how quickly a big lake can heat up given the right conditions and how water temperature may vary from place to place governed seemingly by water depth, flow, and other factors. The map shown on the right will be collected over 3 days. Unfortunately it has not proved possible to do it any quicker. There may, therfore be day to day variation in the readings as well as local variation. For a period the lake will rapidly increase in temperature for every warm day but this will stabilise after a while. The north and middle sections were recorded 24 hrs apart and there seems to be an average 2 - 4°C increase from one day to the next. All these readings are close to the surface, using a thermocouple mounted on a Sounder c. 20cm below the water surface. The measuring method is entirely consistent from sample to sample and, we believe, accurate and reliable. Lake depth was also recorded at each station and shallow water is hotter, deep water is cooler, and very deep water is marginally even colder. It would be interesting to know how much water temperature at deeper levels varies, but we are not equipped to measure this at present. The final stage we hope to complete tomorrow, Wednesday... Those temperatures are now included in Pale Cyan as some data overlaps readings taken in the middle of the lake. The lower sites were sampled between 8am and 12 noon on 10th of July. Weather was initially cool and breezy but quickly warmed up. Samples were taken from the northerly one (20.2°) in an anticlockwise fashion moving south along the middle and the west shore of the lake to Drumshanbo and then returning to Cormongan along the east shore. The last record was the one of 22.4° off Cormongan. Sun, wind, water depth, seem to be the main factors controlling temperature which may now have peaked?
WL15: Hot Weather monitoring! Intro: This evening trip was primarily to study water conditions at a time of rapidly rising temperature. As recently as yesterday the Lake was rough, cool, with a very strong breeze and water temperature was still a lowish, 15.7°C. By this evening temperature had rapidly risen. However, in this brief account, we are happy to report that the lake water appeared largely clean. We have much data to process as we did apply our standard Boat Bubble Test in many areas of the lake north of a line from Yugan Lough to Corry Island. We did encounter occasional areas where our boat was generating large amounts of large bubbles, but these were mainly tranistory and nowhere were we able to record a sustained length of water with significantly reduced surface tension, i.e. pollution. Algal Bloom: A bloom of Cyanophyceae (Blue-green algae) can be expected in warm calm conditions. Happily no such incident was recorded in a long trip from Corry to Druminlass, Yugan to Corry Island, and Corry island back to Corry Beach. However, we did come across a small but rapidly expanding area of dense Cyano-bloom on the east shore of Rossmore Bay. This was in the area we regularly survey for Blue-eyed Grass and other plants. These colonies were recent in origin but are expected to develop fast. Samples and photos were taken and will be recorded here as soon as we can. Comment: This is just a holding Log. We have more to report for this day and during the coming week. Any areas of Bloom (Pea Soup) seen anywhere in the lake should be treated with caution and reported. Apologies for any errors and typos in these logs; they are written in considerable haste.
WL14: Not so clean Lough Allen! Intro: Today we undertook our first Biodiversity survey in a week at the south end of the Lake. It was disappointing; you can see details in LABLog13. We dont attribute this loss of biodiversity to pollution (yet) but it became clear to us, soon after launching, that Lough Allen was not as clean as reported in the previous WaterLog. Concerns: Algal Bloom: Low Risk: Air and water temperature low, water mostly not calm, but much plankton present (including large colonies of Anabaena, a Cyano Bloom species) which could bloom rapidly if conditions change. Concerns: Pollution: High Risk: Much surfactant was evident in the water in patches of the southern lake where the water was becoming limpid. There was considerable upwelling in areas like this with much plankton rising to the surface. Presumably surfactants were coming to the surface or being able to affect the surface in these calmer areas (e.g. west of Long Island and towards the centre of the lake). We are not sure whether these areas are made calm by the presence of materials that lower surface tension, or whether the calmness is due to air and water factors and this allows surfactants to accumulate in calm or limpid waters. No flat calm water was seen on this trip!
We are trying to predict pollution not wait til it happens! We appreciate that some of the pictures, above, do not seem dramatic and the way they are produced may seem nerdy to some? However, they may provide a means of recording the clean up of the lake, hopefully to such an extent that environmental and personal loss will be a thing of the past? The photograph (Right) is a small section of a clump of scum gathered of the tip of Inishfail. The water was limpid here, i.e. almost calm with a smooth surface but still containing some remnants of a swell. These are not the conditions in which natural windrow type foam develops. We were surprised to see this scum (coalesced foam?) occurring here. It is the first patch of its kind this year, though larger patches of scum were recorded off Long Island (in particular) last year. If weather conditions were normal this situation could have been a major Cyano-Bloom! This scum was associated with areas of upwelling water. With the engine off and the boat drifting at the same speed as the water, significant plankton or plant/animal detritus, could be seen coming up from deeper water both seeds, dinoflagellates, other assorted rubbish, but also containing sparse but multi-celled colonies of Anabaena spp. This upwelling may also be bringing surfactant material up from the bottom but we, for one, certainly dont believe this material is of a natural source. This belief is based on the quality of the foam and the condition of water and weather at the time. This surfactant may be producing this foam, as well as the large bubbles diagnosed on our Bubble Tests hence the reason why we conduct these when the lake may seem at first glance to be clear. Unfortunately, our National experts dismiss this evidence and the concerns of local people as a purely natural occurence. With our regular experience on the water we are reluctant to accept this oft cited opinion given with no corroborative evidence. In all our time out on the lake we have never met a survey boat from either Fisheries or the EPA! It is not good science to be dogmatic and we do try to back up our opinions with loads of data, observations, news from people around the lake, and some simple tests. The EPA, we know, do infrequent tests, have concerns about some of their own data, do not understand waterflow in the lake, and seem unwilling to accept what local people tell them? This is a shame and an indictment of good water management; it is the start of a slippery slope towards lower water quality except that they will then simply change parameters and say that the water of Lough Allen meets the new standard while at the same time warning people against swimming in it? Bureaucracy, eh! Why must we wait for another severe algal bloom with associated social and health damage? Compare this photo with the one below, taken nearby. It is unfortunate to have to frequently report bad news. Adverse weather is, obviously, an important factor in declining wildlife in lower Lough Allen. The water is a concern for recreation and tourism and health. We need to make progress in recognising and correcting this.
WL13: Beautiful clean Lough Allen! Intro: Thankfully, we have nothing to report here! Just to say its over a week since the last WaterLog. The picture below reflects conditions all week in Lough Allen, warm and breezy. This day the wind was from the west so this is a picture of Cormongan. Most pictures are stormier the wind was quite strong but this was the prettiest one! Other sites were checked along the east coast all facing into the wind and all equally clean.
You will note small breaking waves in this picture but also nearly calm water to the left. With an onshore wind and calm conditions we have come to expect deposits of persistent foam on the downwind shore. We are very reluctant to say that, whatever happened over the past few years, the contamination of Lough Allen seems to be greatly ameliorating. However, the consistent winds are a slight concern, as they have the ability to break up persisting foam. A characteristic feature of this Summer has been a long period of consistent steady breeze or light winds (from differing directions). This is another significant change in weather patterns from previous years, but it is pleasant weather and tends to pass without comment! This picture does show a very pleasant Saturday evening, on Lough Allen. These conditions seem ideal for Person and Dog if only there were any present? This photo was taken around 6pm. Come and enjoy lovely Leitrim; the water is clean, the landscape is stunning, and the biodiversity is brilliant. Next report wiill be around next weekend. As usual, any news or reports regarding water condition are very welcome HERE... The upcoming week again promises to be warm and, guess what, windy!
WL12: Hottest Day yet! Intro: An early morning tour of the southern end of the lake. For some reason the Biodiversity at this end of the lake is much less obvious than at the northern end. The major breeding colony at The Spit is almost totally abandoned. We believe that this is largely due to poor Spring weather conditions rather than any other factor. However, it gave us time to record a more detailed water quality survey. Today was the hottest day for water temperature in the lake this year. We did see some alarming green streaks and this was the reaon why we took so many samples. Happily, these green spots turned out to be broken up parts from higher plants, a bit like hedge clippings but we were not able to identify them. No Blue-green Algae were found, nor any other significant microbial life. The water quality was good but in a few limpid patches, which existed before the morning breeze roughened them up, we did obtain some marginal low water quality results in terms of lower water surface tension. (Tests 01 and 03) A long and continuous band of foam was present along the shore of Holly Island at 8am. but was not wide enough to meet defined serious levels of pollution. By this time a persistent SE Force 3 breeze was rougening the water here where effluent from Drumshanbo treatment plants passes through the lake. The level of foam was lower than in similar conditions last year. Perversely, however, if the weather had been a bit calmer the pollution might have been worse! Light persistent foam, such as this, can be removed from shorelines by wave action. All results are presented below. It seems that Lough Allen is OK and probably getting better!
Comment: We are heading into a period of cooler and wetter weather and a period free of worry regarding Cyanophyceae bloom, thankfully.
WL11: What a difference in a few days! Intro: What a difference a few days makes? Today we travelled from Cormongan to Yellow River with stops at Yellow River and Stony River from where this photograph comes. This image sums up this day, beautiful weather though with a stiff easterly breeze (we estimate c. 7 knots). The lake was quite choppy in places though hardly any swell as we were in the shelter of the shore. Trip lasted from 6:30am to 10:30am. Water temperatures in open water ranged from 14.5 - 14.8°C. This was a stunning day for Biodiversity (See LabLog13) but also a good one for the environment. Observations: We have been worried for some days that the present warm sunny conditions in Ireland over the past 10 days might trigger an algal bloom in the lake, like we saw last year. All through last Autumn and this Spring there have been worrying signs of foam on and around the lake some, obviously, linked to the presence of surfactants lowering water surface tension. It must be said (warily) that conditions now appear much better! We would say the water had been fully stress tested this week if only those persistent breezes had not been present. They kept the water rippled, temperature a bit lower, and prevented Cyano-colonies (Blue-green algal colonies) from forming. Water temperature was lower today and has not reached the peaks endured last year during the Bloom. In fact there was a significant drop in temperatures recorded today from our previous sampling on the 4th June. (See Water Temperature graph.) This probably reflects the situation but there are two factors that could skew this observation. Most temperatures were recorded before 9am. today and the measurements were from the surface of relatively deep water on the east shore, and there was a strong easterly wind! Samples for microbiological examination were taken off Gubcormongan towards the middle of the Lake. A boat wake Bubble Test was carried out here but, while small bubbles were generated, the test was negative no pollution! Next samples were taken 0.5km. west of Stony River at 7:26am, off Cleigheran Point (7:50am.) and in Yellow River and in Stony River on our return trip at around 9:30. The picture on the right shows the scene at Stony River. Look at the quality of the water, brown, clear, good visibility, no surface foaming either when we arrived or when we agitated the water! Visually this was different to water seen 3 days earlier at the north end of the Lake. The examination of the samples yielded absolutely no microbiological development. None of the species so common in the 3 samples areas reported below (3rd June) were present. On that earlier date a soupy quality existed in the water with small particles suspended in water close to shore. These particles were mostly pollen, water fleas, but did contain small amounts of Blue-green Algae. None of this was present today. The water was pristine! Conclusion: It is amazing to see Lough Allen in such good condition. This is the first trip in two years when we have gone out and seen no contamination at all.The lake is like it used to be from 2001 to 2007 when we used to swim in it. We do hope it will remain so and can withstand further heating and, perhaps, a sustained still water period which we have not really had in the past week.
WL10: Monitoring and Reporting This long field trip was on Monday the 3rd and was primarily concerned with Biodiversity (See LabLog13). Overall the lake water was clean, clear and natural. i.e it was not producing steely persistent bubbles behind our wake, in any significant amounts. (Three negative tests were run.) In 3 very small and very localised areas water surface tension had been reduced by surfactants. In all these areas (Rossbeg, Yugan Bay and Corry Strand) considerable amounts of pollen was present and this seemed to be reacting and causing microplankton to cluster and develop. Particularly in Corry this was producing worrying levels of foam and large persistent bubbles. This was particularly disturbing because it was generated by children playing in the water something we have not noticed before! Please take care if the weather gets very hot, if you see green specks in the water, and if unnatural foam is produced by people or animals in the water. Samples taken at those 3 sites have now been examined. Blue-green Algae are present as well as Dinoflagellates and both these organisms can irritate skin. It must be stated that the Blue-green organisms are mainly present as single cells or chains and large colonies are not being found yet! Observations are presented below in the form of environmental photographs and microphotographs of some of the organisms obtained. We hope you find this interesting. There is now (at time of writing) no major reason for concern but the known causes and the known possible outcomes need to be watched vigilantly.
WL9: A Watching Report. This is largely a holding account. As you can see it is over a month since a Water Log was filed. We have been active during this period and several boat trips were undertaken. On each of these occasions we tried to determine if a quantitative record of water quality could be obtained. Several Bubble tests were attempted on each trip at both the north and the south end of the lake. All proved negative. It seems that the variety of testing procedures we have set up are heavily dependent on calm weather to be effective! (But this should apply to chemiocal/physical testing procedures also?) Consequently we have had no definitive results to report during this perion. However, this does not mean that Lough Allen water is as clean or as normal as we might wish. On the contrary, there are many impressions of dirty water and watar producing foam that seems unnatutral. We are simply trying to get data and produce maps demonstraing quantifiable amounts of pollution in various parts of the lake. The persistent cold, windy and choppy conditions has made this evidence hard to gather. Main purpose of toays trip was to record water temperatures and see if it was possible to undertake Quantitative Visual Observations on water quality. Trip lasted from 5pm to 8:30pm and area covered was the west coast from Srabraggan south to Holly Island and then across the lake from Jennys Island along the east shore all the way down to Corlough Bay. No definable levels of pollution were recorded but, on a purely personal level, the water seemed dirty and increasing clumps of scum developed as the wind increased through the evening. Our water surface tension (Bubble test) was attempted but while medium sized bubbles were present they did not persist in the way we reported on the Last Log item below. However, at time of writing (June 2nd) the forecast is for warm and calm weather later in the week. This should make our tests viable, we should get either positive or negative (hopefully) results and, if conditoins develop as predicted, an algal blool is possible. Obviously, we will update this pollution watch as soon as we have any definitive data. WL8: Serious Indication of Pollution. Spring bursts forth: This was a varied day weather-wise but one in which good numbers of Mergansers and other Summer visitors were seen, for the first time. (See LabLog2013). Survey work was carried out by boat between 7am and 10:30am covering the area from Cormongan, all the islands south of there, and down as far as Holly Island and the large bay just north of Drumshanbo. Weather and water conditions were variable with a considerable amount of bright sunshine and calm waters interspersed with some grey misty weather with increased westerly wind (force 4) and choppy water. Water Quality: Sadly this was another of those days! It seemed good at first with no signs of foam on the shore at Cormongan or on the westerly side of Long Island or Jennys Island, where it couild be expected in these conditions. Instead we found 3 parties of Mergansers excitably exploring and seeking nesting sites! One major example of pollution was, however, encountered during the morning. This rates a 4 point score using the Bubble Test (Test F) described in our Testing Procedures. This indicates a severe change in water quality from the norm. Details of observations and procedures are given below. Apart from this no other quantifiable or severe signs of pollution were recorded today. Perhaps an improvement, but the change in water viscosity is an alarming and striking phenomen indicative of contamination in the water.
Conclusion: This is a Severe Example of this pollution effect! SCORE = 4 (SEVERE) We intend doing as many tests like thes as possible and plotting them over the lake in Charts, like the one in WL7 below, to try and identify areas where water quality is being altered presumably by the inflow of some detergent or surfactant. The size of the bubbles may, of course, reflect increased levels of naturally generated gases in the area.
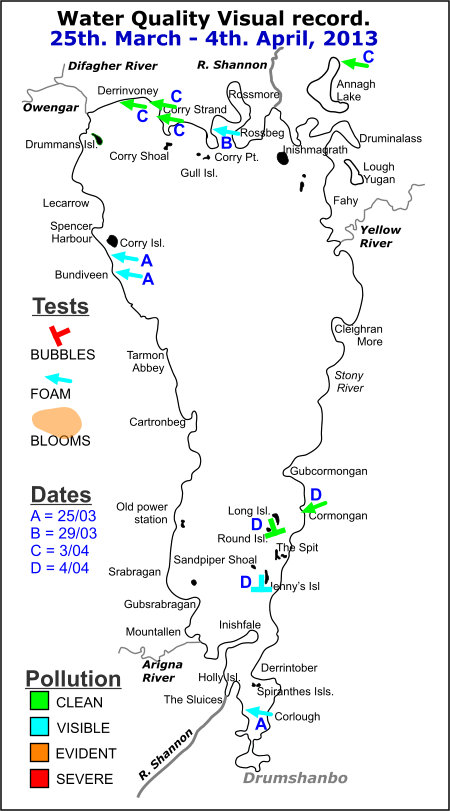
WL7: Testing VISUAL Techniques! Hope for Summer: At the time of writing (4th April) the weather has at last got brighter and there is hope for Summer. We are trying out more standardised methods of Visually Assessing changes in the condition of Lough Allen. Today was a lovely day on Lough Allen and it is possible that conditions may be on the mend and the distressing pollution and No Swimming notices that we saw on Lough Allen last year, may be a thing of the past or else it is just the long cold dry spell is reducing run-off from the surrounding hills and effluents will return with the rain! But vigilance is required and we will continue to monitor water quality in our own inimitable style. Just because the water looks good does not mean it is healthy; that we wont know until we get a spell of hot weather and the Lake survives that without a blue-green algal bloom. That would be real progress. In this WaterLog we start to implement the Visual Assessment Techniques described in the Water Index Section, HERE. These are.. A. Continuous Shoreline Foam The work in the past 2 weeks has concentrated on Continuous Foam assessment in a period of cold easterly winds. Thankfully, very little was found. What was found was on western shores of Lough Allen and the main point of this Log is to... 1. Explain Techniques. 2. Quantify Pollution (little and all as it was), and 3. Map Pollution. Points are allocated for length of shore coated with foam, amount of foam, and foam in calm weather. (See Visual Indicators Table.) Points are assigned for each element and scores of 0 - 3 (or 4) are obtained for each of the Tests A - F. Shoreline deposits are Mapped using Arrows which indicate the direction of the wind and point to the precise point where the test was conducted. Arrows (and other symbols) can be in 4 colours representing the degree of pollution determined. 0 = CLEAR (Green) Other Markers are used for other tests. It is hoped that these methods will enable us (and others) to record and report visual signs of pollution in Lough Allen. By quantifying and mapping these occurrences we should be able to notice change and work towards a decline in the severe pollution witnessed in the Lake in 2012.
WL6: Mostly Homework!
|
|||||||||||||||||||||||||||||||||||||||||||||||||||||||||||||||||||||||||||||||||||||||||||||||||||||||||||||||||||||||||||||||||||||||||||||||||||||||||||||||||||||||||||||||||||||||||||||||||||||||||||||||||||||||||||||||||||||||||||||||||||||||||||||||||||||||||||||||||||||||||||||||||||||||||||||||||||||||||||||||||||||||||||||||||||||||||||||||||||||||||||||||||||||||||||||||||||||||||||||||||||||||||||||||||||||||||||||||||||||||||||||||||||||||||||||||||||||||||||||||||||||||||||||||||||||||||||||||||||||||||||||||||||||||||||||||||||||||||||||||||||||||||||||||||||||||||||||||||||||||||||||||||||||||||||||||||||||||||||||||||||||||||||||||||||||||||||||||||||||||||||||||||||||||||||||||||||||||||||||||||||||||||||||||||||||||||||||||||||||||||||||||||||||||||||||||||||||||||||||||||||||||||||||||||||||||||||||||||||||||||||||||||||||||||||||||||||||||||||||||||||||||||||||||||||||||||||||||||||||||||||||||||||||||||||||||||||||||||||||||||||||||||||||||||||||||||||||||||||||||

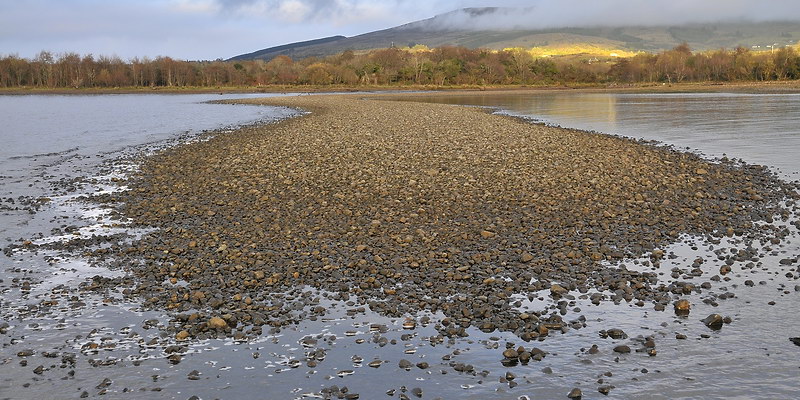
 Lough Allen
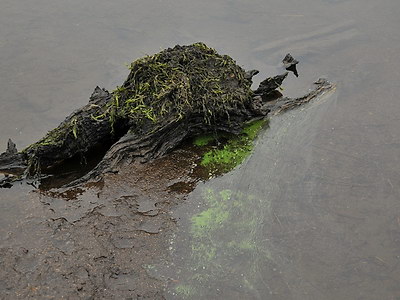
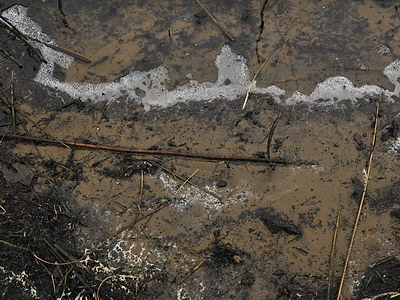
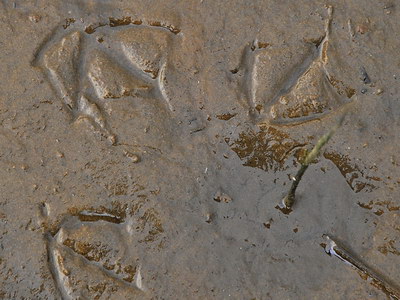
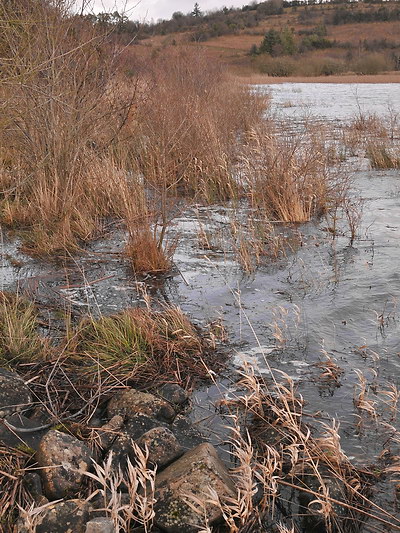
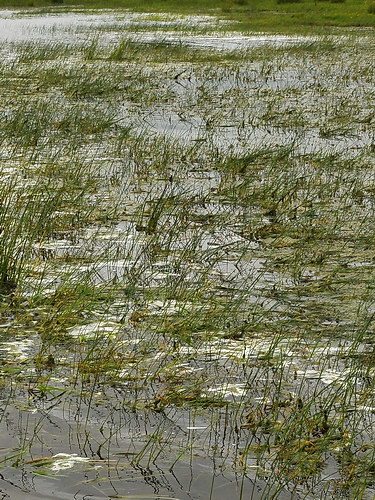
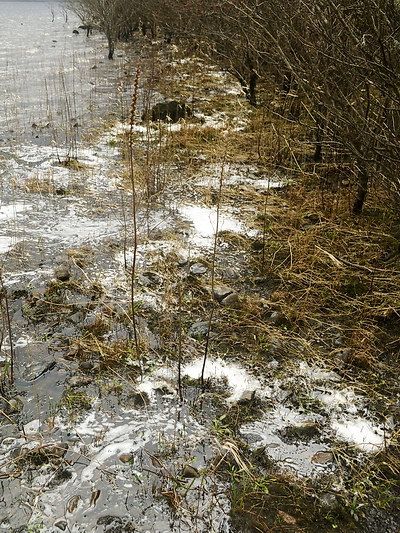
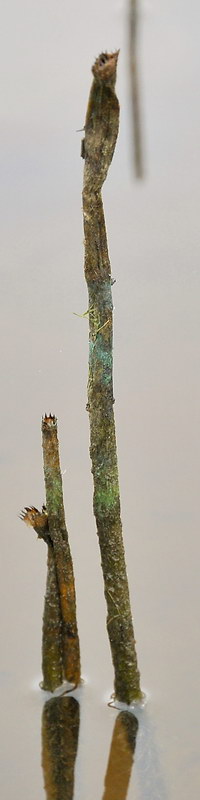 Old rotting Horsetail stems pepper the shore at this location.
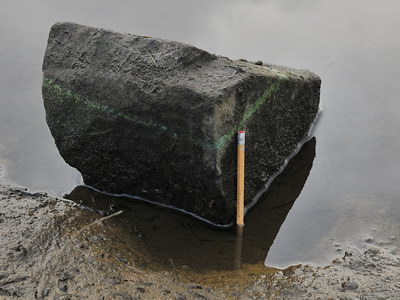
 Magical Markers:
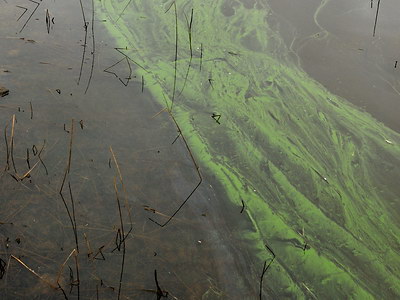
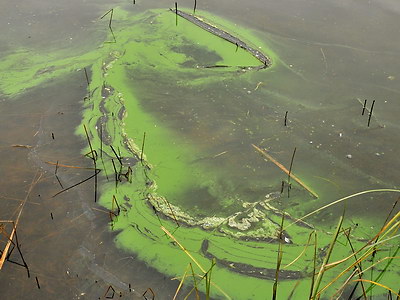
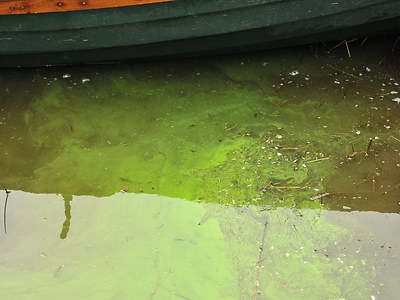
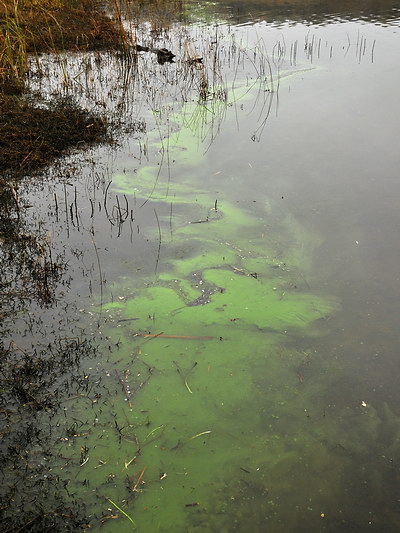


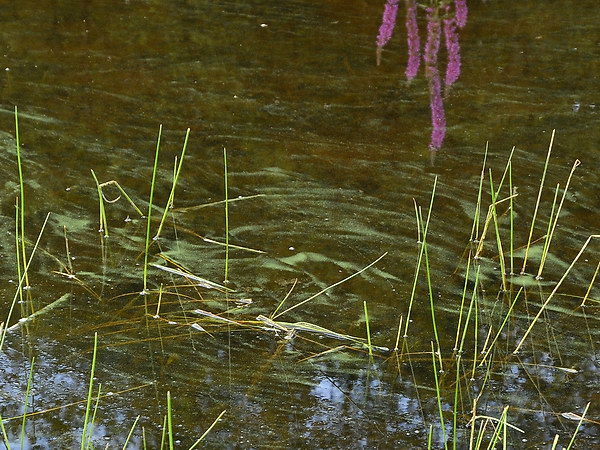
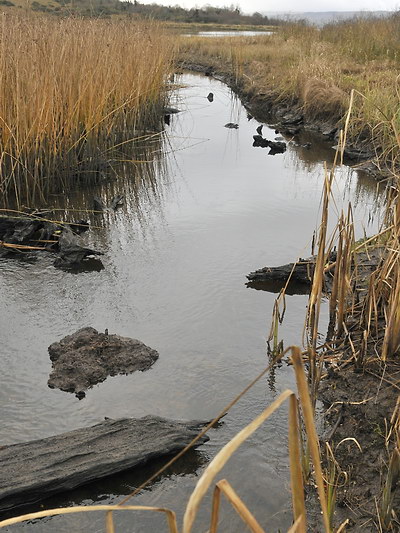
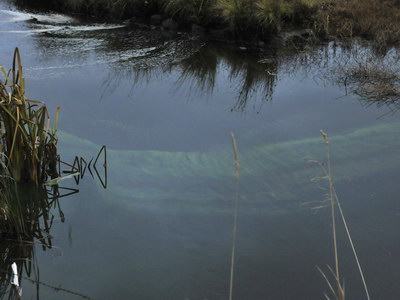
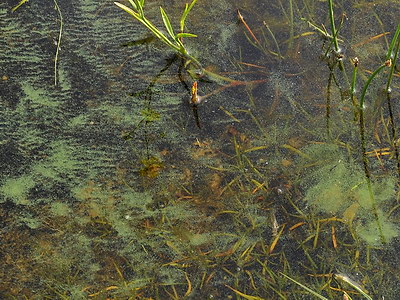
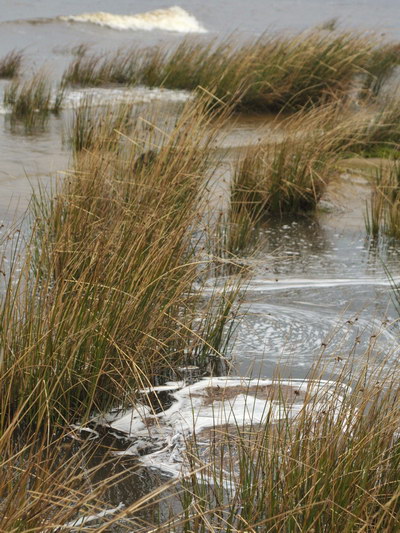
 Today for the first time in 3 weeks we have observed a small Cyanobloom (a blue-green algal/Cyanophyceae bloom). This bloom was found in the still water shown on the left of the photograph above. This is a still channel (sometimes dry) between the two small islands we call Spiranthes Islands, off the Corlough Shore in Drumshanbo Basin. We have seen a short-lived but intense bloom in an isolated pond in this area several years ago.
 Observations II: Foam and Bubbles.
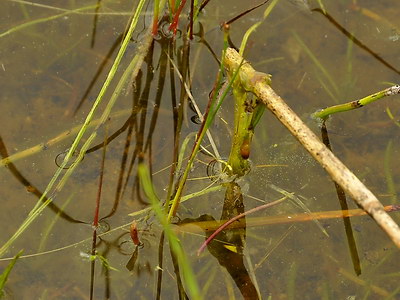
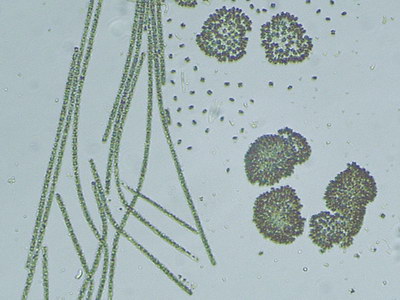
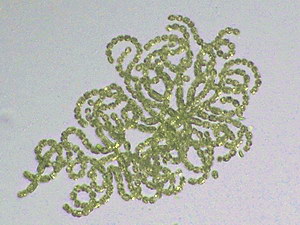
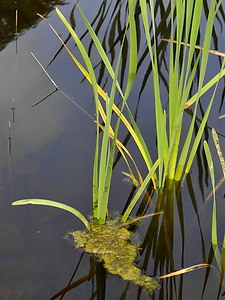 The filamentous green wooly material in the LEFT photo is Green Algae and, Yes, it is a true alga like seaweed.

 Comment:

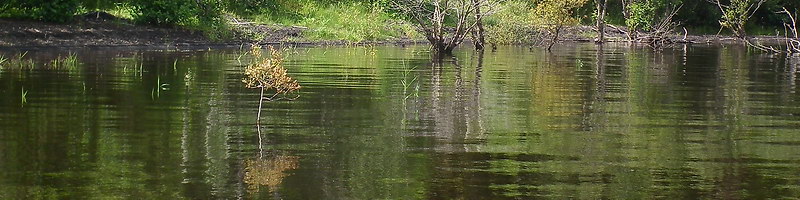
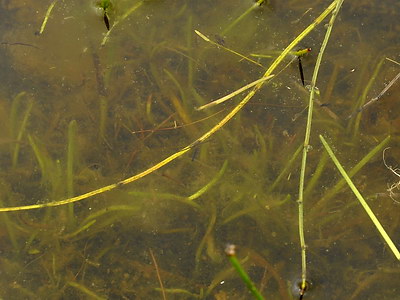
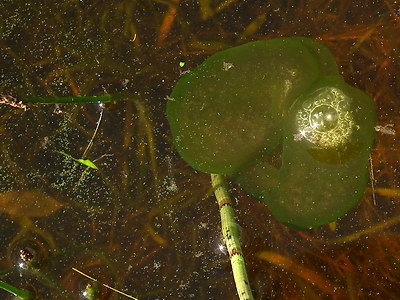
 June the 3rd was a perfect day. Some stunning places, plants and animals. Everywhere we went the water was clean and limpid, like under the Boat here.
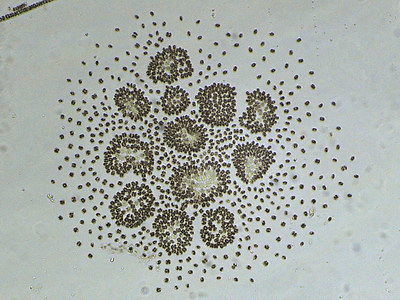
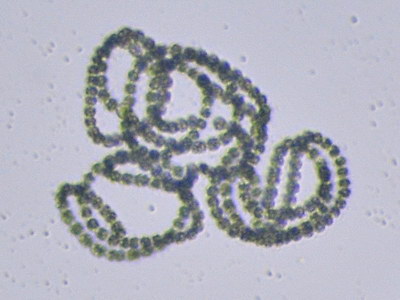
 The various elements involved in this dirty water have been identified. This is Anabaena sp., a Blue-green alga which was present in very small quantities in all 3 locations.
 These 3 photographs are from the same place, the west shore of Rossbeg inlet at the north end of Lough Allen.
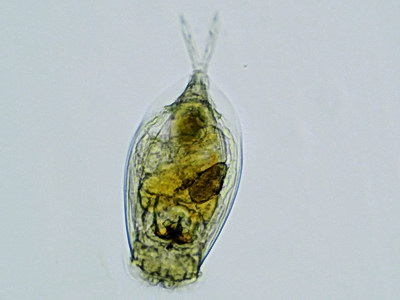 A Rotifer.
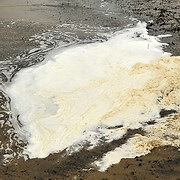
 Cloose up of the contamination found at this small spot. Similar yellow or grey coloured contamination was found in two other places. The second site was at the mouth of the channel leading out of Yugan Lake a west facing shore.
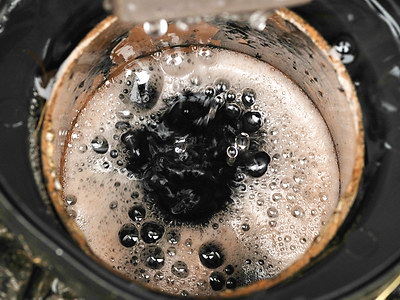
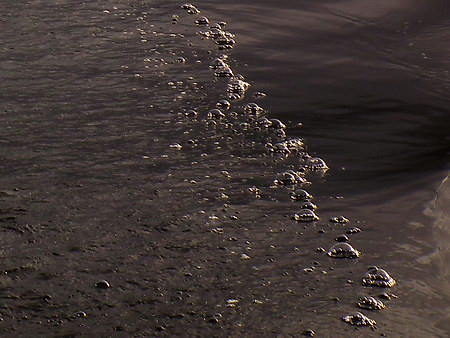
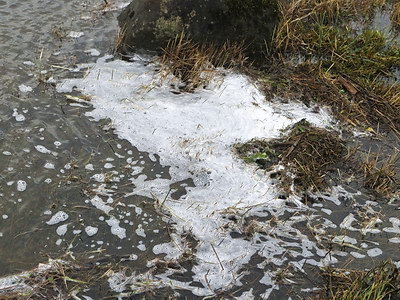
 The various elements forming the scum have been identified. But where is the foam coming from? Could it be synthetic pollutants providing the surfactant and generating the foam?
 This is a small section of Corry Strand near the car park. Water offshore was clear. The bubbles and scum seen here was produced by children playing!
|
Try it yourself...
You will find a Draft Chart of this proposal HERE. We would emphasise that this is a highly experimental idea that we have been considering for a while; the ideas are our own but they do seem to have some support in a European research study into Foam in the aquatic environment. (More of this anon.) Do have a look at the Chart and if you think it can be applied to the situation near you, we would be delighted to hear it. We hope to be able to define water as Pristine, Pollution not Evident, Pollution Evident, and Pollution Severe using a scoring System of 0 - 3(4). All the tests described will enable people to collect information in a much more consistent manner, to share it, and to, perhaps, produce regular meaningful maps of the water quality arouind the lake. The black bubbles shown in WL5 (below) feature as one of our assessment parameters.
Anyway, on the 19th, tired from the computer work LAB staff (all of them) went on a hunt for Mergansers. They are still in the sea around Sligo though we cannot presume these are Lough Allen birds? Anyway, this hunt was successful and 1 lone male was met on Annagh Lake. See LabLog2013 for details.
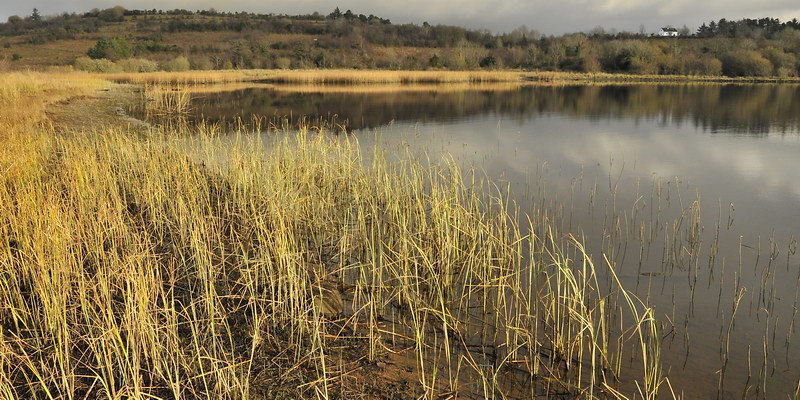
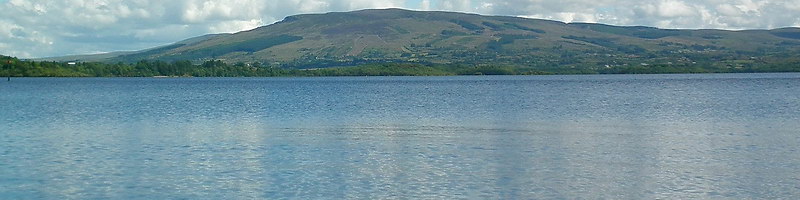
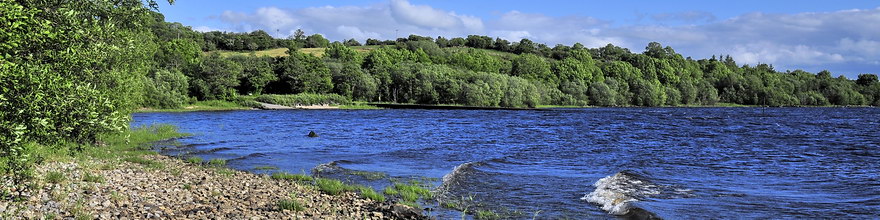
Lough Allen looking healthy!
This dry spell and low water level seems to be suiting the lake. It was good to have a hunch confirmed L. Allen, at present, seems to have many areas with pure brown water and no foam. Why? Is it the lack of run-off? The survey covered many sites from Cormongan and around the north shore to Srabraggan on the west shore. At Srabraggan a small fringe of foam was present along a shoreline facing into a stiff north easterly breeze. At a glance it was possible to see that under Test A (See Chart) for low level linear foam, this incident of foam was not going to score any points. This would mean that the water was pristine, which it wasnt! Oh Heck, back to the drawing board. However, the water and the vast majoritiy of shores visited were pristine, with Corry Strand and Druminalass looking particularly beautiful.
WL5: Beautiful days on L. Allen
25th & 26th February 2013
North and South of Lough Allen
These two days were the best so far this year. After about 10 days of drought the Lake was at a fairly low level (2.4m) and considerable areas of shoreline were becoming exposed. Biodiversity was on the move but this is reported elsewhere! The first day involved a walking study of Lecarrow to Corry Strand and then a visit to Annagh Lake in the north east. (Locations are shown in map at bottom of this page.) The second day involved a boat trip, the first of the year, across the lake from Cormongan and south as far as Corlough near Drumshanbo. This was intended as a test run to check our equipment after a long winter lay-up. However, everything worked perfectly from the start, so we were able to get in both a good bio-study and a water survey.
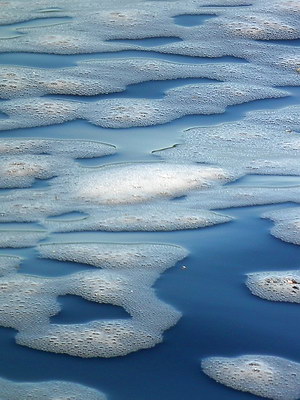
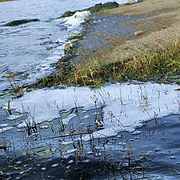
Shore Summary: This dry calm weather is suiting L. Allen! There has been a marked drop in the level of foam since our last report. A lot of the shore on the north west contained ice along with very occasional pockets of frozen foam. We find the concept of frozen foam interesting there must be a very strong binding agent holding the bubbles together? Some of this foam also contained amounts of small flies. Annagh Lake, the area shown in WL4 below, was clear of all visual signs of contamination today. However, the water conditions were calm, cold, and the water was totally flat. With any bit of agitation one suspects that the foam fringe might reappear?
Boat Survey: This lasted from 9:30am to 12 noon. This was a tale of two lakes! From Cormongan latitude south to Inishfail, the lake was flat calm, water temperature was c. 5°C., and it was bright and sunny throughout. In these conditions absolutely no foam was found on the east shore, even in troublesome areas such as the stream entering at Cormongan pier. This stream appeared to be carrying no contaminant but was also flowing so gently as to, perhaps, not generate any foam? As we headed south from Inishfail the air temperature dropped from 4.5° to 0°. This was due to an intense fog being generated from the top of Slieve an Iarainn and being carried straight across the lower lake by a stiff easterly breeze. This suddenly, and totally, changed the climate in this area of the lake. We have never seen such a sharp weather divide in Lough Allen. The winter conditions persisted around Drumshanbo well into the afternoon.
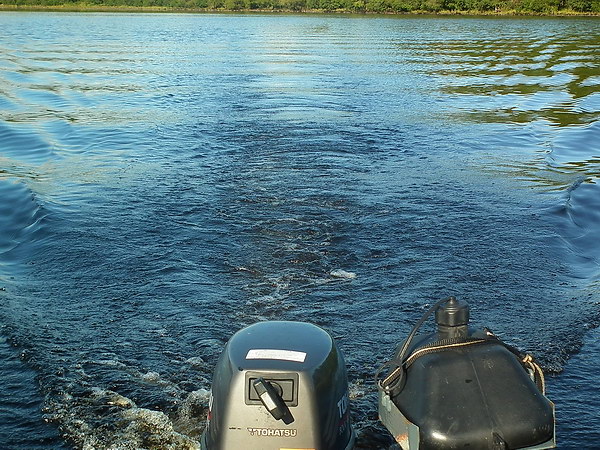
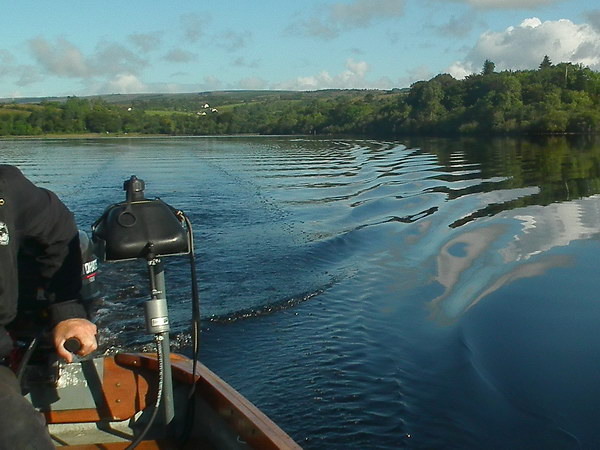
 Weather Impact on Pollution: As we were travelling south from Cormongan we appreciated the clear, calm and clean water. The only visual indication of an altered water quality lay in our wake! Large leaden bubbles were being left behind and remained visible in the distance. This is a phenomenon we often observed last Summer and is due to a decreased surface tension in the water, like what happens when children add detergent to manufacture play bubbles. As we passed Inishfail and entered the gloom a persistent easterly wind arose. This seemed to have been partially due to the squall effect and also due to coming out of the shelter of Sliabh an Iarainn. For example, the windmills opposite Cormongan were still whereas the smaller ones further south were operating. Foam was being generated here in a short choppy stretch of water. Ice was present in large rafts stretching westwards from Spiranthes Islands (Corlough) and water temperature had dropped to 4°C in the channel. This rapid change in conditions had totally reversed the good water quality observed further north. In this Corlough area the EPA had reported high phosphorus levels and it seems as if the weather conditions was now leading to foam being produced from associated artificial surfactants. Water from Drumshanbo treatment plant would pass through this area on its way to exit the lake via the Shannon River.
A thin continuous band of foam was present all along the shore at Holly Island where this water, the small waves, and the easterly wind, combined to generate it and deposit it. As we went north again it was interesting that a similar facing shore, north of the Sluices, was only peppered with occasional patches of foam. i.e. most of the foam producing material had flowed northwards from Drumshanbo and exited the lake via the Sluices?
Apologies for the text heavy report; we are working on a system to quickly map and illustrate areas of foam deposition and associated water and wind conditions. To summarise these two days... Lough Allen was looking great apart from a very small area north of Drumshanbo where foam was widely visible. Other areas looked pristine but in all locations visited it was possible to produce persistent bubbles by agitating the water. This phenomenon will be discussed futher in the context of a âFoam Reportâ™Â kindly furnished to us by the EPA.
WL4: Stormy weather at L. Allen
28th. January 2013
East and North East of Lough Allen
 Our first Water Log of 2013. Not too much to report but we just wanted to get the ball rolling. The most obvious feature of the end of the old one and the start of the new year has been the persistently miserable weather with continuous rain, some cold, and some strong winds. We took the opportunity of a break in the rain combined with persistent strong SSW winds to visit areas of Lough Allen where significant large deposits of synthetically based foam were left after southerly storms in April 2011. Results of todays brief survey were good and bad! There were no large deposits of foam. The foam seems to have a tendency to be resorbed into the water in stormy weather. This is a phenomenon we have seen in mid April 2011 in between times of more visible pollution, and which we demonstrated HERE! The absence of large visible deposits does not mean the pollutant has gone away and we fear it will be back as long as the cause is not determined and controlled.
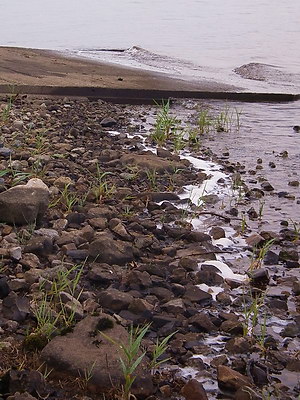
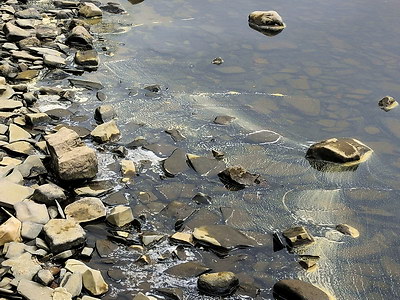
Close view of beach near Cormongan Pier with natural looking breaking waves carrying no artificial foam hitting the upper beach. Note the flow of water in the background which does, however, contain the foam we are concerned about, streaming into Lough Allen. In calm weather foam often accumulates in this area if blocked from entering the lake by a westerly breeze. Today there was a strong flow of water from this stream.
Apart from this slight concern, the shoreline at Cormongan was clean. We would be keen to celebrate this but past experience teaches us never to jump the gun. We, regretfully, anticipate that, in changed conditions, the band of foam will reappear along this shore. But we do have to report clean normal conditions when we see them!
|
||||||
WL3: STREAMS & DRAINS
29th. November 2012
All around Lough Allen
This work was done on a Thursday at the end of November after a largely dry week and shortly before forecasted heavy rainfall. A series of tests and observations were made on rivers, streams and small drains entering Lough Allen. We have paid particular attention to accurately describing the visual condition of the waterway at the time of sampling. Water samples were also taken and brought home for measurement of Phosphate levels. Results have been ambiguous. Firstly, though most water bodies were visually contaminated, several of these yielded clear tests for Phosphate. Secondly, sites tested previously under similar conditions, and with similar appearances, yielded different results this time. We believe that there is a link between foaming (of this nature) and the enrichment of the lake that we have seen expressed in the form of algal blooms. It has been suggested that on a calm dry day (such as this) visual contamination may build up and remain in slow flowing streams but that the phosphate in solution may pass through irregularly depending on its time of release
DEFINITIONS:
FOAM: Specifically refers to persistent bright white dense small-bubbled foam. It may float down in patches or lodge as clumps behind obstructions. It can be re-generated by waves.
SCUM: Refers to larger areas of flat contaminant often with a brownish tinge covering significant patches of water. Not moving and seems to have been in place for quite a while. Probably of the same origin as above.
CLOUDY & CLEAR: Two words we use to describe quality of water under the foam. Cloudiness can come from floods, mud, etc, or from pollution. Clear means bottom of waterway is clearly visible and normally of the typical brown hue common to waterways in the area.
RESULTS:
Results and observations for 21 sites are reported below. We apply equal weight to Phosphate results and visual results. They both indicate contamination, maybe in different ways.
|
||||||||||||||||||||||||||||||||||||||||||||||||||||||||||||||||||||||||||||||||||||||||||||||||||||||||||||||||||||||||||||||||||||||||||||||||||||||
COMMENTS:
The colouring of Data shown in the righthand column has the following significance. Orange records can be regarded as Nil values. 0.04ppm is within the level of sensitivity of the apparatus used. Red data are records where a surprisingly high Phosphate reading was obtained. In wl302 this was a very small drain and maybe any phosphate present had been concentrated in some way. Also, there were cattle drinknig from the drain if this can have any impact? The four sites from wl316 - wl319 all were remarkably clean, by far the cleanest streams we have seen around Lough Allen in a long while. It was surprising that wl317 gave a significantly strong reading. (Please note that all the visual observations were recorded before the analytical tests were done!). Blue records are ones where, from the visual inspection, we had grounds for expecting a detectable level of Phosphate and got none!
The LOCATIONS:
This survey was conducted in a clockwise manner over 2½ hours. Samples 01 and 21 were taken from the south of the lake. Samples 02 to 09 came from the western shore. Samples 10 to 14 from the north shore, and the rest from the eastern shore.
We have reverted to using Latitude and Longitude readings on both our GPS and in Maps. It seems to be much more accurate. The values given in the Table above can be copied and pasted into http://www.bing.com/maps/ and they will (should) bring you to a Map of the area in question. We apologise if this is less convenient than using the National Grid. One thing we dont advise is using convertors to change the Latitude & Longitude readings back to Irish Grid.
ANALYSIS:
Lough Allen is polluted. Phosphate is a significant part of that. We know this from the presence of significant Blooms of Cyanophyceae (known as blue-green algae). These produce toxins fatal to dogs and harmful to humans. If Phosphates reach a sufficient level, and remain at that level, algal blooms will continue to exist and destroy the recreational and tourism value of Lough Allen.
Phosphates occur in Detergents, and many other products. Household detergents were traditionally discharged into a Septic Tank or a Soak Pit located away from waterways. Now they are mixed with sewage and discharged into a mechanised Septic Tank located close to waterways. Unfortunately these Septic Tanks do nothing to reduce the Phosphate levels coming out of them. The imposition of these waste handling criteria on home owners in the past 10 years, or so, may directly have contributed to the foaming problem in Lough Allen?
In our experience of the Lake from 2001, it has been a clean Lake with no conspicuous signs of eutrophication. From 2006 we have been studying the Diversity of Life around Lough Allen. Only in the past four years have we seen any visual signs of eutrophication (adding nutrients to the water that help new forms of life to flourish). Even then it was the merest hint of a line of foam on a suitable shore in gentle wind. But now... it is everywhere!
The work reported in the Table above has two goals:
1. To check, at one point in time, if the source of the contamination is widespread and all around the Lake, or just from one major source.
2. To seek to find a way of monitoring contamination that will enable us to say if it is on the increase or is decreasing. This way we can restore Lough Allen!
Our conclusion, sadly, is that this pollution is coming from many disparate sources. i.e. quite likely from many small homes and enterprises. We fully accept that this may be unknown to the persons involved and may also be as the result of Planning Conditions. The coincidence of timing between the onset of this contamination, the Celtic Tiger, and changing Planning Conditions is too clear not to suggest a causal relationship between development and the pollution of Lough Allen. However, simple steps can rectify this situation!
The relationship between contamination and Phosphate levels is not so clear. Phosphate is soluble in water and may rush through a sample site in a very short while following a small discharge of a detergtent type product upstream. Foam and Scum, which can be derived from various factors but especially detergents, are not readily soluble in water. Well, actually, what we call natural foam will break down in water within a matter of a few seconds; the persistent thick white foam that we are seeing around Lough Allen in recent years, does not dissolve so rapidly. This is the reason, we think, why some streams may one day have high Phosphate levels and another day have no detectable levels. Also it may be the reason why some highly visually contaminated Sites have recorded zero levels of Phosphate. However, the bigger the river the higher the chances of getting a null reading will be; its simply due to the level of dilution in the river. It is very hard to record positive levels of Phosphate in large rivers such as the Owenmore and the Shannon!
WL2: Chasing the Foam!
17th. November 2012
North East Lough Allen
We have been championing the role of visual and biological observations in recording and (hopefully) controlling the pollution of Lough Allen. Here is a collection of pictures we have published before except for the one on the right taken today:
|

The Hypothesis Phosphate/Detergent contamination can effectively be monitored visually and biologically.
We have been testing this hypothesis, and a monitoring instrument, over the past month. This Log brings this work up to date. There does seem to be a close correlation between visual signs of pollution and the levels of phosphate present in the water but there are several complicating factors.
Complicating Factors
DILUTION: In any area with a high volume of water it seems to be impossible to measure Phosphate levels. They are simply below the level the technology can detect.
WEATHER: To obtain meaningful phosphate levels samples need to be taken appropriately. You cant schedule a vist for the 29th February 2012 and hope to get true results. If it was raining heavily, or if it rained steadily the night before, the sky may be blue but the waterways will be full of water and zero readings will be obtained. This does not mean that there is no waste material or products containing phosphate (like detergent) being carried down the river it is simply unreadable due to the high level of dilution.
SMALL STREAMS and DITCHES: Very much the reverse of the above. Because of the low flow of water it is easy to get a false high reading. Local factors such as somebody washing a car, or a football team having a shower, or some fertiliser accidentally getting into a ditch, or concentrated release of high levels of natural Phosphate, may temporarily give an unusual high. So the ditch or stream will need to be monitored on an on-going basis to see whether it is an unfortunate accident or on-going eutrophication.
PHOSPHATE SOURCES: Fertiliser and rock phospahte are not foaming agents. Detergent and all materials we use in washing our bodies contain varying amounts of Phosphate but are all foaming agents many of them producing persistent white recyclable foam such as we have been finding around Lough Allen in ever increasing amounts over the past few years.
STUDY 2A:
We are trying to establish, here, a link between the various signs of pollution, summarised by the photographs above, with a measurable quantity of Phosphate in the water. Locations are not being specifically identified as our goal is to try and improve our environment in a very constructive manner. If this project is successful it may be possible to set up a system whereby people can readily and regularly check for Phospahte levels in small waterways near where they live.
The first four photographs above show signs of eutrophication, specifically Phosphate enrichment. These are all based on open water in Lough Allen and we lack any facilities for physically or chemically measuring Phosphate at such low levels in a large water body. The last photograph is from an inlet off Lough Allen and, yes, we have been able recently to record Phosphate levels here. Further photographs from this site are reproduced below:
|
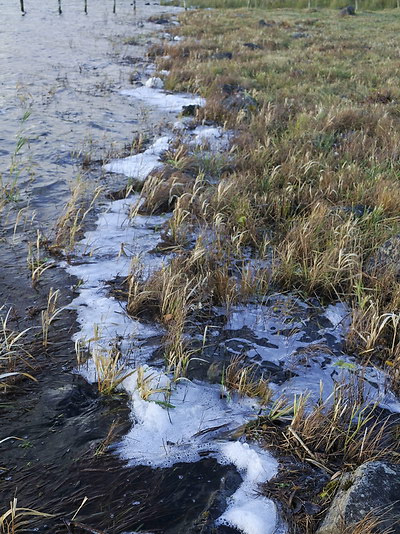
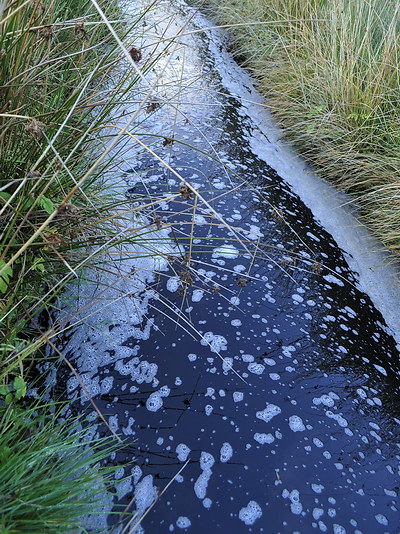
Simple Testing Equipment for low-level Phosphate pollution:
We are using a Hanna low-level phosphate analyser. This reads Phospahte levels from 0.00 to 2.50 ppm (parts per million) with an accuracy of 0.04 ppm. Use of this is very much on a testing and investigative basis as of now, but this handy bit of kit may be accurate and practical enough to provide early warning of water conditions likely to provoke the onset of future Blooms in Lough Allen. The device is a photometer and it can be used in the field but we tend to prefer to bring samples home as it is quite time consuming. Firstly, the Photometer is calibrated. Then a sample is inserted and the Photometer is zeroed to make allowance for the colour of the water. (Photometers analyse specific compounds by measuring the colour and saturation of the sample.) The Phosphate testing reagent is then added and the amount present is measured by passing a fixed colour light beam through the sample. The Photometer then delivers a reading of Phosphate concentration in terms of parts per million of Phosphate.
Results:
Other tests (below) have returned null, or undetectable, levels of Phosphate in areas where riveres were visually polluted. As we gain more experience with our local conditions we can predict likely results more accurately. There is a clear correlation between visible contamination, water body size and flow, and the concentration of Phosphate present. We sampled further upstream where the water was flowing rapidly between stones. The water level was moderate, definitely not low but not as high as a few days later after heavy rain. Sampling and recording was done on the 17th November.. We were pleased, from a technical point of view, but saddened that we were indeed able to get a measurement of this pollution!
We obtained a reading of... 0.1 ppm Phosphate... This is Pollution! It is 3x higher than what the EPA considers as a Phosphate level in rivers that leads to eutrophication.
As usual, in science, nothing is immediately clear. The same stream, further up, on a different day, and after much rainfall, gave a result of 0.02 ppm on the 21st November. This was within the margin of error of our equipment and we think the greatly increased water flow may also have had an effect but there are other factors that we cannot discuss here. However, we believe the above figure stands as we have got similar results from other small streams that we know are polluted.
STUDY 2B:
By contrast to the above Study we have also looked at the Owenmore River, a large river collecting a lot of water from streams in Leitrim, Cavan and Fermanagh. While initially investigating the upsurge in pollution in 2011 we, assisted by our work experience student, investigated many of the tributaries of that river and prepared our site location map of the upper reaches of the Owenmore. We did basic foaming tests on water from these sites but were unable to prove presence of significant quantities of detergent at that time. The photograph below shows the heavy detergent load being carried by this river in 2011.
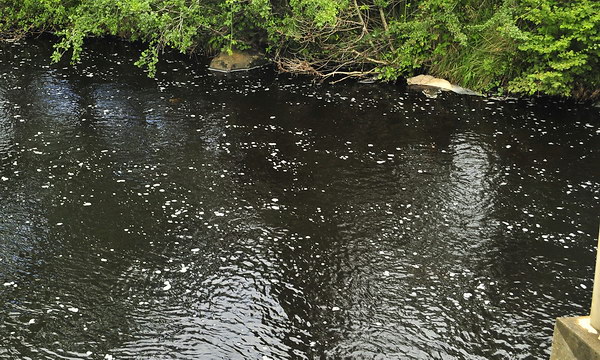 Of all the significant rivers entering Lough Allen this often appears to be the most foamy. We have often wondered why. There is a lot of clear felling going on in the area with consequent fast run offs and the availability of increased organic Phosphate but this is slow to be released. There would not be a large population or large towns in the area to provide the household effluent in large quantities. We do not know the answer to this question yet but, one thing we have learnt, is that a small amount of detergent from domestic use can have a significant impact on a nearby stream or lake.
Recently, we have revisited this site and we have gone to the upper reaches in search of Phosphate content. This was a dry day but after some rain so the two little streams and the one major river section we sampled, west of Glangelvin, all had a moderate flow of water. Foaming was present in small amounts in the two upland samples and more obvious at Glangelvin.
We obtained a reading of... 0.00 ppm Phosphate at all Sites!
Judging by the foaming and the permanent nature of it, it would seem likely that there is some source of foam producing material entering the water. The zero or undetectable reading would reflect high level of dilution afforded by the Owenmore system and even the small mountain streams after rainy weather. We report this research just as an example of how difficult it is to measure Phosphate at low levels and yet how persistent some detergent, or whatever product is lining our river banks and lake shores with foam, can be.
Even the 0.02 ppm level specified as the risk threshold for Phosphate in lakes is going to be very difficult to detect by physical means. The true solution to pollution in Lough Allen is for us all to avoid letting Phosphate containing material into the environment from treatment plants, household detergents, fertiliser, rock phosphate, shampoo and bath products, car washing and other industrial activity. We will continue seeking sources of such contamination in small waterways entering Lough Allen, hopefully leading to a clean up of the environment over the next few years.
WL1 |
October 2012 |
North and South of Lough Allen |
||||
|
|
||||||
|
|
BLUE = Clean areas 6th. October. 1:30 - 4:30pm from Corry Strand. Water 13.8°C, Air 12°C, Wind largely calm. Water level 2.7m. Covered the northern end of the lake sticking close to shore and visiting all the inlets. Stream at Corry, which sometimes contains detergent, was clear. Quite a bit of pollution was observed using our by now standard techniques, particularly in a large area between Church Island and Gull Island where the Shannon was flowing through the lake. This large stretch of water was covered with large blobs of scum which with the relatively calm weather should not have been there. 7th. October, Cormongan, 9:30am to 1:30pm, Water 12.2°C, Air 10°C, easterly light wind. Water level 2.66m Covered all of the southern parts of the lake, shown on the map, today. Encountered scum floating on either side of the Cormongan Islands and moderate deposits of white synthetic foam on the lower west shore of Long Island and Jennys Island. Large area of calm water north of Inishfail was heavily contaminated with very extensive circular blobs of scum. Also a large area of black bubbles (shown in the Banner above)was met in the channel east of the tip of Inishfail a place were we have often met these before. Delightfully, the area south of this that we covered was apparently clean and a pleasure to travel through. (Indicated as the blue patch north of Drumshanbo.) 9th. October. Corry Strand, 10am - 1pm, Water 12.7°C, Air 10.5°C, steady breeze from the north west with occasional slight squalls. Water level 2.56m. We headed directly SE to Cleighran More marina. The whole transect was contaminated with large rounded blobs and this is represented by the southerly edge of the Red Area in the map. Only when we went closer to shore and headed along the shore to Druminalass, did we find a continuous zone of clear fresh water. The stony estuary at the Yellow River, in particular, was perfect. There seemed to be no pollution coming down the Yellow River at this time. The black bubbles were again encountered in the channel between Deadmans Point and Church Island (Inishmagrath). |
Comments on this Map: We make little comment on this Map. This is just a start. The methodology needs to be tested and corrected. Also, one set of data is pretty meaningless; if a series of maps reflect similar patterns of contamination then, maybe, we will be able to identify sources. The Map on the left was produced following 3 long trips traipsing across the lake. This period was one of the longest consistently dry and largely calm periods we have had this Summer/Autumn. Water levels were dropping and new water flowing into the lake was at a low level. The large rivers (Shannon, Owenmore) were still full but smaller streams such as the Yellow River were at a very low level. I know this page is linked from the Home Page saying Water Quality Maps. That is with an eye to the future. We do not anticipate many further periods with the necessary calm and dry weather to allow us to repeat this experiment before next year. Observations: If we can just make a few comments. The blue areas inshore at the north end of the lake were strikingly clean but lay very close to bodies of water that seemed heavily contaminated. Perhaps there is a vortex here that protects these areas from contamination in these particular weather conditions. Also, Yellow River itself seemed absolutely pristine in terms of visible contamination. Similarly the area south of the main lake discharge (through the sluices) was also notably cleaner than the area immediately north around the Inishfail promontary. In fact the bay on the north east corner of that headland was holding a lot of contaminated water either from the Arigna River or else travelling down from the Shannon system
|
||||
|
|
||||||
|
|
|
|
||||
|
|
|
|
||||
|
|
|
|
||||
|
|
|
|
||||
|
|
|
|
||||
|
|
|
|
||||
|
|
|
|
||||
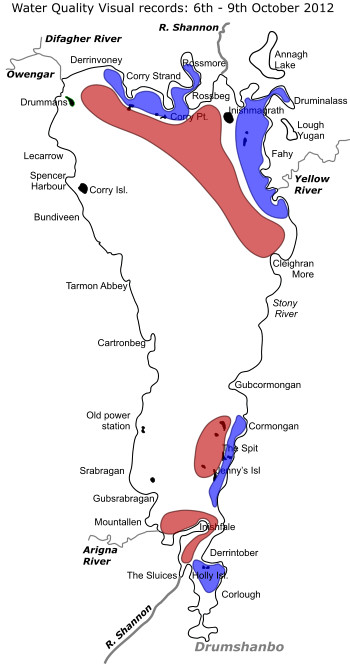
left