|
WORK PAGES
DRAFT ### DRAFT ### DRAFT
wtTop2
LoughAllenBasin.com
Water QUALITY Topics index.
Wt 2. Quantifying VisuaL OBSERVATIONS:
16/3/13
This is a work in progress produced in response to new information becoming available in regard to foam in the environment, its role in pollution and destruction of a tourism amenity, and our ways (and others) of observing and recording such visual observations. LoughAllenBasin.com is of the view that visual records are valid, particularly in quickly noticing and notifying change in a water body. They also, if carefully applied may be more effective overall. The EU Water Framework Directive requires quantifiable numeric data largely based on technical tests. These tests may be operating at the limits of available technology even with sophisticated and very expensive equipment. It has been validly pointed out that the value of visual observations — which can be undertaken by anyone — would be greatly increased if a system of framing these human observations into a consistent and quantifiable format could be developed? It has been suggested to us that... ‘if we can do this then we may be onto something!’ Nothing like a challenge, eh?
We use many methods to record what we perceive as pollution in Lough Allen. These have been developed higgledy piggledy over the year. Standarising them has proved difficult. Lough Allen is a big place. There is a conflict between biodiversity research and water quality monitoring. Also, one person’s view of a situation will be different to another person’s. In the table below we have shown some of the typical images of the contamination of Lough Allen in recent years and have tried to define an approach to accuirately describing such situations. Some form of measurement is required if the amount of pollution is to be recorded in a way that can be compared from place to place and year to year. The tests are diverse but most can be conducted from shore. Length of shoreline continually affected, length of shore line intermitently affected, percentage of a defined area of open water covered with foam (i.e foam determined as being synthetic in origin), are all factors that can be studied. Also wind, weather, temperature and wave size need to be noted. This is a lot to undertake but, perhaps, the illustrations below may be the start to a process whereby many people can help in recording increasing or decreasing levels of contamination around L. Allen. Remember, this is a record of visual pollution and may not reflect the actual pollution of the water as factors such as temperature and wind force may show up the pollution more on certain days.
These TEST may be altered as we try them out!
Table WT 2.1 Visual indicators of the presence of pollution:
|
Sample Image
|
Description
|
S c o r i n g
0 No pollution / 1 Not Evident / 2 Evident / 3+ Severe
|
|

|
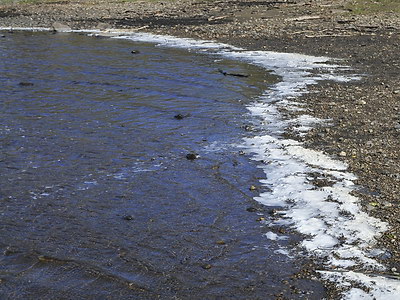
A. Continuous shoreline fringe of persistent foam.
Foam is persistent. i.e not dissolvinig or dissipating within 30 minutes. It is continuous, forming an unbroken fringe along the shore for more than 100m.
Foam has all the characteristics of a synthetic origin, persistent, fine bubbled, brilliant white!
This sign is very common on flat calm days when a slight breeze develops in the afternoon. This breeze may be too light to generate even ripples but foam fringes have often magically appeared on shores facing the wind!
|
1 point is given for each item below that applies:
Continuous Foam for 100m. or more.
Width of band greater than 1 metre.
Foam piled up in layers.
Water calm with no waves, only gentle onshore breeze.
Points are simply added up, 0 points means the water is pristine, 1 means water seems clean but a certain sign of contamination is visible, 2 means pollution is evident and 3 or more signifies that the area is severely polluted.
How your Score equates to Pollution is shown under the Scoring Banner above. (So, if all points above were ticked that would be 4 Points — indicating SEVERE pollution!)
|
|

|
B. Intermittent shoreline fringe of persistent foam.
Foam is present on leeward shores but may not be unbroken. Breaks can be caused by changes in shore conditions such as rocks, steep slopes or a change of aspect of the shore.
Foam line may be very thin (as shown here), may be moderate (above) or very broad. This photo only shows about 3m. of shoreline.
Where large amounts of foam is present on a shore but is distributed in patches then this may be recorded.
|
1 point is given for each item that applies:
Much Foam present with some clear patches.
Width of band at maximum greater than 1 metre.
Foam piled up in layers in sheltered areas.
Water calm with no waves, only gentle onshore breeze.
Add up your Score and refer to Scoring Index.
|
|

|
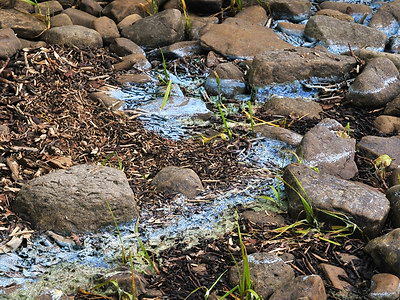
C. Unnatural blue shoreline patches left after foam.
This is a very unnatural occurence, so far only seen in the Spring and Summer of 2011. That year all samples of this material was found on a narrow band of shoreline coinciding with the water height on the 1st. April, 2011, when a srong southerly wind deposited massive bands of foam along much of the north coat of L. Allen
This material is believed to be blue-green algal remains left in the foam on the shoreline and taking a month or two to dry out. These ‘Cyanophycea’ are green when growing but develop the typical cyan colouring as they decay. It is a spectacularly brilliant blue and caused many local people to enquire what was the ‘blue stuff’ on the shoreline.
|
Hopefully it may be a long time before we see this again. It is hard to postulate a methodology for quantifying levels of this material present. Any at all seems to show that a severe pollution episode occured at that spot within the past 2 months.
For the sake of completion, choose 1 item that best fits:
1 point if only one 25cm. patch is seen on a shore.
2 points where many patches are seen on the one shore.
3 points if a continuous deposit of 5m. or more is found.
|
|

|
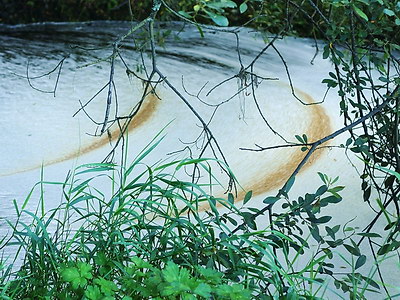
D. Static scum on lake either near shore or in open water.
Sometimes in Lough Allen, and in quiet water channels entering the lake, foam has built up to such an extent as to obliterate the dark colour of the water underneath. In the centre of the lake, along flow channels, extensive but narrow bands of dense scum have been seen. We call this stagnant foam, scum, as it has characteristics somewhat different to freshly generated foam found on the shores. It may be contaminated with other waste material or it may be generating algal blooms from the nutrients it bears.
The points system reflects the amount of surface area covered in calm areas or else the length of scum trail traveling down the centre of the lake. We have seen a continuous trail of scum more than 1km. long in the Summer of 2011.
|
A cumulative point system is used again, 1 point being allocated for any of the following that apply:
a water area of 10 sq.m is obliterated by foam or scum
a line of scum exists for more than 10 m. in open water
further point is added if this extends to 100m.
further point added for a scum trail of 1km. or longer. |
|

|
E. Blue-green algal bloom visible in water.
This area of scum runnig down the midle of L. Allen off Cormongan was bordered on either side by little green flecks and some streaks where colonies of Cyanophyceae had clumped together as they rapidly multiplied. They were readily visible to the eye but not so clear in this photograph.
A ‘pea soup’ is formed when these growing colonies coalesce into a body of water that becomes uniformly green and impossible to see through. At this stage poisonous toxins may be produced and released into the water. These organisms bloom in response to calm weather and increased levels of phosphate in the water — possibly coming from detergent type products entering the lake.
|
Points are awarded for the number and extent of colonies of Cyanophyceae monitored. These are always present but become quite easily detectable when warm calm weather causes them to multiply and clump together as visible green flecks. So select 1 item from below that best fits the conditions:
1 point for occasional areas of water with green flecks.
2 points if large areas of the lake contains green flecks.
3 points when clumps tend to aggregate into lines.
4 points if more than 10sq.m. of ‘pea soup’ occurs. |
|

|
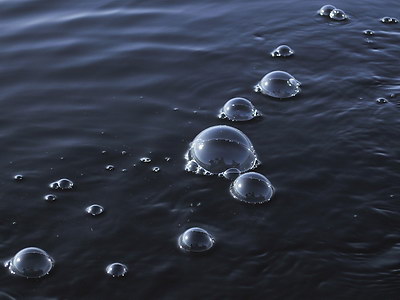
F. Large bubbles formed from lower water surface tension.
Water surface tension can be reduced by surfactants. This allows unusually large bubbles to be produced when the water is disturbed. Here is a STANDARD BOAT TEST that can effecively indicate the water condition. (Large bubble in image was size of a tennis ball!)
1. Motor in a straight line at 5 knots and observe boat wake.
2. Go for 1 minute (150m.). Note start and end points.
3. Are bubbles grape, golfball, or tennis ball size?
4. Note outboard shaft length, prop. diam, and horsepower.
6. Note water temperature, wave conditions, other pollution.
|
We first encountered this phenomenon off Inishfail in 2011. Moving into ‘different’ water we observed a clear trail of bubbles in our wake. In subsequent years this has become common and it is more striking when we enter an area where we leave no ‘wake’. Indeed, bubble trails left in calm weather may still be visible up to an hour later! If you cannot provide all information do please keep speed and time.
Scoring is by adding points together with 1 point awarded for each of the following that applies:
Persistent bubbles generated at each side of the boat.
Bubbles are golf ball size (1pt) or bigger (2pt).
Bubbles visible over full length at the end of run.
S C O R I N G
0 No pollution / 1 Not Evident / 2 Evident / 3+ Severe
|
|
We intend trialing these systems in the next couple of months and will report how it goes, and if we record any pollution!
|